

In this article, we’ll dive into a comprehensive guide about the various tools available in Visual Studio for the debugging and profiling of multithreaded .NET applications. Multithreading, that sounds scary. Well, not really.
Let’s begin.
What is a Thread
Let’s start easy. In simple terms, a thread is like a small worker within a computer program. It’s a part of the program that can do tasks independently. Threads enable our program to simultaneously manage multiple tasks, making it more efficient and responsive.
You can learn more about threads here.
Creating a Multithreaded .NET Application
Let’s create a simple .NET Web API Application and jump into the debugging tools of Visual Studio:
[ApiController]
[Route("[controller]")]
public class WeatherForecastController : ControllerBase
{
    private readonly ILogger<WeatherForecastController> _logger;
    public WeatherForecastController(ILogger<WeatherForecastController> logger)
    {
        _logger = logger;
    }

    // Get weather method
    [HttpGet(Name = "GetWeatherForecast")]
    public async Task<IEnumerable<WeatherForecast>> Get()
    {
        IEnumerable<WeatherForecast> returnedData = new List<WeatherForecast>();
        await Task.Run(() =>
        {
            returnedData = GenerateRandomWeather();
        });
        return returnedData;
    }

    // Generate random data
    private IEnumerable<WeatherForecast> GenerateRandomWeather()
    {
        string[] Summaries = new[] { "Freezing", "Bracing", "Chilly", "Cool" };
        Thread.Sleep(3000);
        return Enumerable.Range(1, 5)
            .Select(index => new WeatherForecast
            {
                Date = DateOnly.FromDateTime(DateTime.Now.AddDays(index)),
                TemperatureC = Random.Shared.Next(-20, 55),
                Summary = Summaries[Random.Shared.Next(Summaries.Length)]
            }).ToArray();
    }
}
Inside the GenerateRandomWeather() method, we’re generating the random data with the help of a separate Task.
To have a better view regarding threads when debugging, we add a simple line of code to our GenerateRandomWeather() method before returning the IEnumerable collection:
Thread.Sleep(3000);
This means that our current thread will sleep for three seconds before returning the collection.
Visual Studio Tools for Debugging and Profiling Multithreaded .NET Apps
In this section, we’ll examine the various tools intended for debugging multithreaded applications, integrated inside Visual Studio.
To learn more about debugging in Visual Studio, read our article.
The Threads Window
The Threads window in Visual Studio is a helpful tool in our debugging arsenal. It allows us to view and control the execution of different threads in our application. It can help us analyze synchronization issues, thread interactions, or bugs. We can find it under Debug > Windows > Threads after the app is started.
Let’s start the application and put a breakpoint on the next line after the Thread.Sleep().
Once we request the method, our breakpoint is hit. Let’s now see what the Threads window looks like:
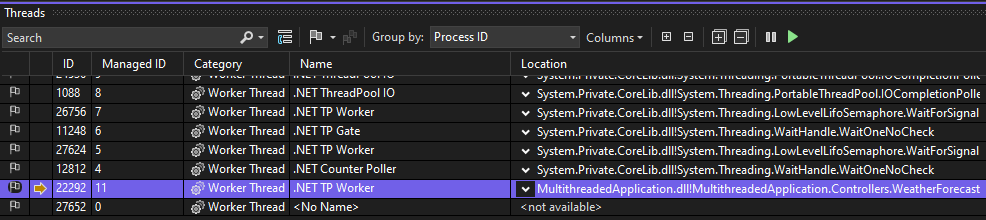
On the left-hand side, we can see the list of threads. The one line highlighted and indicated with a yellow arrow is the thread we’re currently in. On the right, the call stack is also shown, correctly pointing to the line where we placed our breakpoint.
Our current thread is a Worker Thread. This means that it is a Thread Pool thread and is used for short-lived actions.
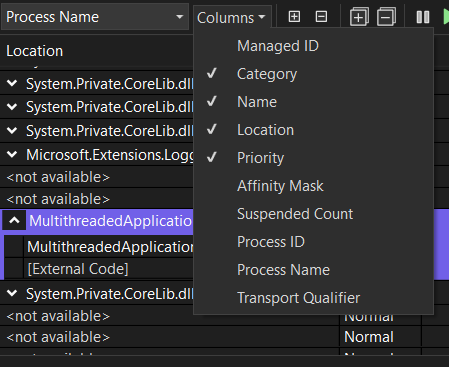
As for selected thread information, we have only four columns for now: Category, Name, Location, and Priority (which is on the far right, not shown on the screen). We can add more columns by clicking on the Columns tab on top:
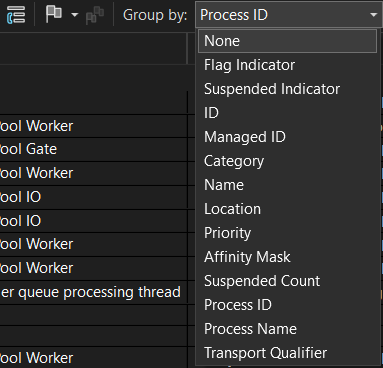
We can also group the threads by different properties when clicking on the Group by tab:
Let’s see what happens when we try to group our threads by Location:
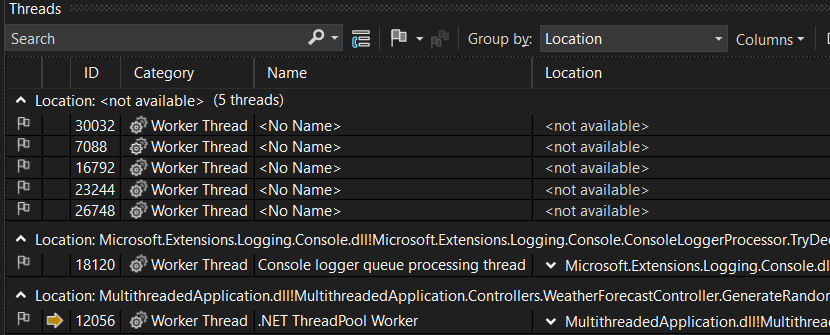
We notice how threads are spread throughout different locations in our application. It seems that at the location of our breakpoint, only one thread is active.
By right-clicking on the thread list, we notice an interesting option called Show Threads in Source:
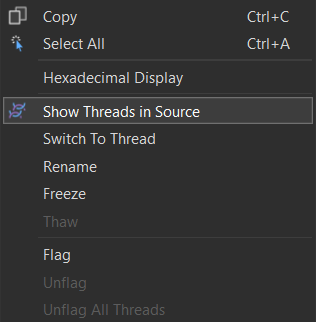
While selected, two blue and purple lines appear over our breakpoint. If we hover over it we should be able to see which threads are making use of that particular line of code:

Flagging Threads
If we want to keep track of some special threads we have the option to flag them. This option is present in both Threads and Parallel Stacks (we’ll discuss this later) windows:
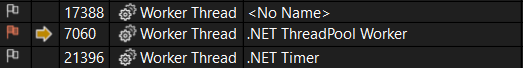
Clicking on the little flag icon tracks the thread, and the icon changes to red.
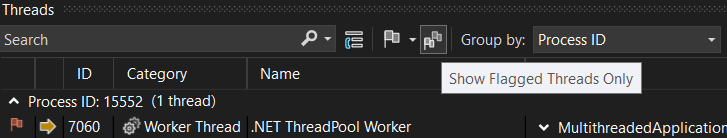
If we want to see only the flagged threads, we can select the Show Flagged Threads Only option:
Freezing Threads
When working with multiple threads, we sometimes need to exclude some of the code when debugging. Therefore we have the option of freezing a thread, which means that the thread will not be debugged anymore.
We’ll be adding two more threads to our method and on both of them we’ll invoke another separate method in which we’ll log the generated weather data:
// Get weather method
[HttpGet(Name = "GetWeatherForecast")]
public async Task<IEnumerable<WeatherForecast>> GetWeather()
{
    IEnumerable<WeatherForecast> returnedData = new List<WeatherForecast>();

    await Task.Run(() =>
    {
        returnedData = GenerateRandomWeather();
    });

    Thread thread1 = new Thread(() => LogWeatherData(returnedData))
    {
        Name = "Log Thread One"
    };
    Thread thread2 = new Thread(() => LogWeatherData(returnedData))
    {
        Name = "Log Thread Two"
    };
    thread1.Start();
    thread2.Start();

    return returnedData;
}
We create two threads named ‘Log Thread One’ and ‘Log Thread Two’ that log weather. After the creation, we start them.
Here’s the log method:
private void LogWeatherData(IEnumerable<WeatherForecast> wheaterList)
{
    foreach (var item in wheaterList)
    {
        Thread.Sleep(100);
        _logger.LogInformation("Temperature: " + item.TemperatureC.ToString());
    }
}
For logging data, we’re using the Microsoft.Extensions.Logging NuGet Package.
Now, let’s put the breakpoint on the Thread.Sleep() method inside the loop.
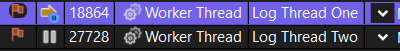
Let’s see what we get in the Threads window:
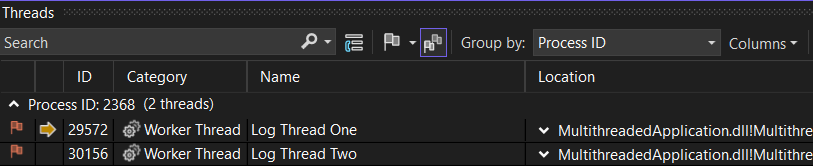
We flagged our newly created threads to track them better.
The yellow arrow indicates our current location is on the ‘Log Thread One’ thread. Each time we press the F10 button to continue, the arrow alternates between the two threads, signaling the switching of threads.
But what if we want to pause seeing what happens on the ‘Log Thread One’ thread? What if we want to debug only what happens on another thread? That’s where freezing a thread comes in handy.
By right-clicking on the desired thread and selecting the Freeze option, we’ll pause the thread:
Now, our debugger will stop switching threads, and show us only what happens in the ‘Log Thread Two’ thread.
To resume the thread activity, we can use the Thaw option. Just right-click on a frozen thread and select the Thaw option from the dropdown. This way we have full control over each thread running during the debugging process.
The Parallel Stacks Window
This window lets us see the call stack information for the threads active at the moment when the breakpoint is hit. It is most useful when we are debugging parallel code in our application. It also displays a visual representation of threads or tasks.
Let’s see how this looks in the Parallel Stacks window when our breakpoint is hit right after the Thread.Sleep() method. We can open it by going to Debug > Windows > Parallel Stacks:
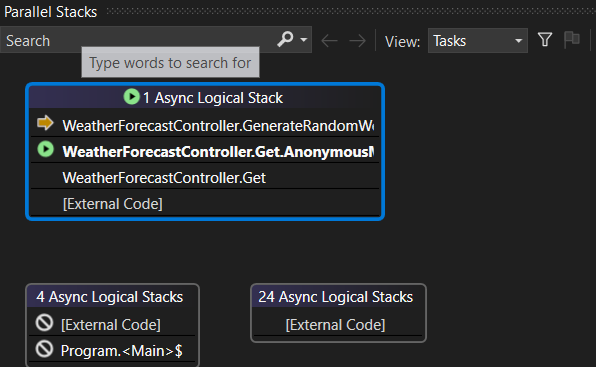
We can see here a visual representation of the call stack. The yellow arrow indicates the current thread, and by clicking on the next line below the arrow, we’ll be navigating further back on the stack and to a different thread.
External code means that the threads following are outside of the current class, we have the option to see them by clicking on the Show External Code option on the navbar.
We also have the option of filtering threads by selecting the Filter icon from the navbar. We can select individual threads or specific modules to filter by.
Conclusion
In conclusion, debugging and profiling multithreaded .NET applications is a very complex and nuanced topic. For this Visual Studio comes to our aid with powerful tools, making this task a little simpler.