

The code we write doesn’t always work the way we want it to. It could be due to a syntactical error or a logical one.
While the compiler generally points to the syntax-related errors and helps us fix them, logical errors aren’t that straightforward. This is when we need to figure out why our code is not working, and although talking to a rubber duck about it does sound more fun, it’s more efficient to use a debugging tool.
In this article, we are going to use look at the Visual Studio debugger for debugging a C# application.
Let’s begin.
What is Debugging?
Debugging is the process of running our code step by step in a debugger and identifying, analyzing, and removing errors (also known as “bugs”) from our code.
Let’s start by creating a simple application and a method:
public static string GetMultiplicationTable(int number)
{
    var result = new StringBuilder();

    for (int i = 1; i <= 10; i++)
    {
        result.AppendLine($"{number} X {i} = {number * i}");
    }

    return result.ToString();
}
This method takes a number as input and returns the multiplication table of the number.
To start the debugger, we can use the F5 key or select the Start Debugging option from the Debug menu. Alternatively, we can also click on the Debug Target button from the toolbar. This starts our application and since we didn’t set any breakpoints, the code executes and we see the output on the console.
To stop debugging, we can either use Shift + F5, select the Stop Debugging option from the Debug menu, or click on the Stop Debugging button on the toolbar.
However, this wasn’t any different from starting an application without the debugger attached. To understand the real use of the debugger, we would have to start setting up breakpoints.
How to Set Breakpoints?
A breakpoint is a step in our code, where we want to pause the execution and examine the program’s state on a particular line. Breakpoints are one of the most essential features of any debugger.
To set up a breakpoint in Visual Studio, we can either click on the left margin of the line of code or press F9. If we did it correctly, a red circle will show the presence of a breakpoint.
With the breakpoint set let’s start debugging the application again:
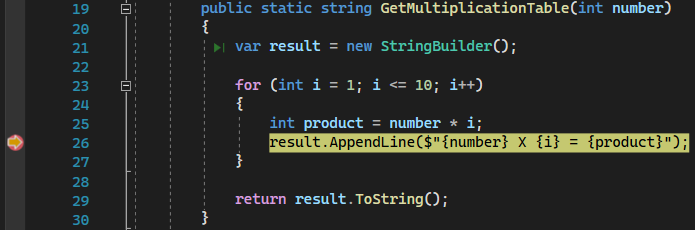
This time, our application runs till it encounters the breakpoint and then the debugger pauses the execution. The highlighted line of code denotes the statement where the execution is paused. The debugger does not execute this statement yet.
Once the application is paused at the breakpoint, we can examine the line of code in detail or navigate through it.
Navigating the Code
We have three options when navigating through our code: Step Into, Step Over, and Step Out.
Step Into causes the debugger to go inside the method call on the current line and pause the execution there. If the current line doesn’t contain a method call, it moves the debugger on to the next line. We can use F11 or Debug > Step Into option to step into a method call.
Step Over advances the debugger to the next line without stepping into any method call. This option is useful when we want to get the return value from a method without going into the implementation details. We can use F10 or Debug > Step Over option to step over.
Step Out causes the debugger to continue executing the current function and pause the execution when it returns. In other words, Step Out takes us back to the point where we decided to Step Into. We can use Shift + F11 or Debug > Step Out option to step out of the current function.
In addition to using keyboard shortcuts or the Debug menu, we can also use the Debug Toolbar options:
![]()
Inspecting Variables
Now that we know about setting up breakpoints and navigating through the code using a debugger, let’s focus on the most important reason to debug any code i.e. to analyze the state of an application.
We can inspect the values of the variables using a debugger.
The various ways to inspect variable values while debugging are:
- Hovering over the variables
- Using Locals and Autos windows
- Setting up Watches
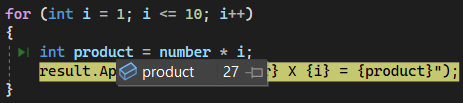
The simplest way to find the value of a variable at any particular time of execution is to just hover over them. So, hovering over the variable i in the statement for (int i = 1; i <= 10; i++) will give us the current value of the variable:
During a debug session, we can use the Locals window to see the values of the variables defined in the current method (local scope). The Locals window option is present at Debug > Windows > Locals or we can use the (Ctrl + D, L) combination of keys.
In addition to that, we can also use the Autos window to see the variables defined on the line of code the debugger is at, and the preceding line. To access the Autos window, we can select the Debug > Windows > Autos or we can use the (Ctrl + D, A) combination of keys.
Both Locals and Autos windows list all the variables available in their scope. Sometimes, we might want to focus on the value of a particular variable or expression. Here is where the Watch window comes in handy.
The Watch Window
We can add any variable or expression to the Watch window and monitor its value as we navigate through the code in real-time.
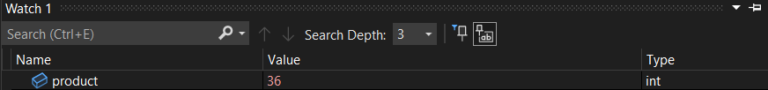
Let’s set up a watch on the product variable. With the debugger attached, we right-click on the product variable and select Add Watch. This opens up the Watch window which lists all the variables we’re watching.
The watch window updates the value on each for loop iteration. Any change in the variable value is highlighted in red:
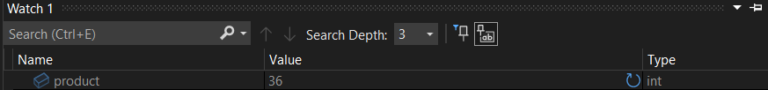
Any variable or expression we add to the watch window remains there even when the said variable or expression goes out of scope.
In our case, the product variable and its value are grayed out once the variable goes out of scope. We see a refresh icon beside the value which indicates that the value shown is stale:
Conditional Debugging
Based on the number of items in a list, debugging through the list may become time-consuming at best and borderline impossible at worst.
Let’s imagine a scenario where we have a list containing thousands of Vehicle objects. Out of these, one object with theId 989 is not working as expected. Now, this already becomes too time-consuming if all the objects are sorted according to the Id property. Not to mention this becomes even more emphasized if the objects are unsorted. Hence, we can eliminate the possibility of iterating over each item and verifying its Id.
Here’s where conditional debugging comes to our rescue. It is especially useful when working with loops. All we need to do is to set up a breakpoint, right-click on the breakpoint and select the Conditions option. Alternatively, we can also use Alt + F9, C.
This opens up a Breakpoint Settings window where we can set conditional expressions:
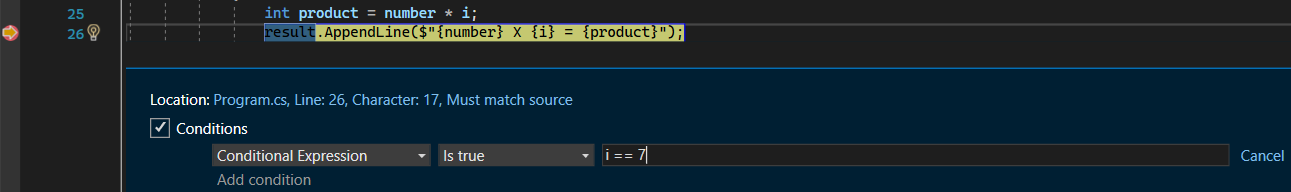
In doing so, the breakpoint pauses the code execution only when the conditional expression specified evaluates to true. In this case, the debugger will stop if the variable i matches 7.
Debugging Threads
Another scenario where conditional debugging is helpful is when dealing with multiple threads.
While debugging in a multi-threaded environment, we can filter out a single thread and keep our debugger attached to it. This helps us avoid thread switching during debugging.
To lock our debugger to a single thread, we can set a conditional breakpoint. When selecting the conditions, instead of Conditional Expression, we use the Filter option from the dropdown and then specify the ThreadId or the ThreadName that we want to lock on to.
To get the ThreadId or ThreadName, we can select the Debug Location option from the View > Toolbars menu. This option contains three fields: Process, Thread, and Stack Frame. We can get the information about the currently executing thread from the Thread list. It is marked by a > symbol in the dropdown.
Call Stack
Another important use of a debugger is to understand the execution flow of our app. The call stack helps us achieve that. It keeps track of the order in which the methods are called.
To view the call stack while debugging, we can select Debug > Windows > Call Stack or use the keyboard shortcut Ctrl + Alt + C. A yellow arrow denotes the current method where execution is paused.
Let’s take a look at our application’s call stack:
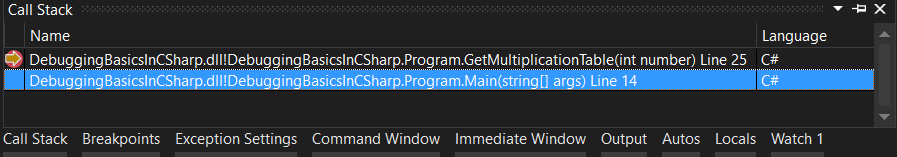
The top stack frame represents the current function, GetMultiplicationTable. The next stack frame shows that the GetMultiplicationTable method was called from the Main method.
We can double-click on any of the stack frames and go to the line of code where the preceding method was called. This changes the current scope of the debugger but does not advance it.
Conclusion
That covers the basics of debugging a C# application using Visual Studio. We’ve learned a lot about the most important features in debugging breakpoints, navigating the code while debugging, conditional debugging, and call stack.
We encourage you to go and play around using this knowledge.