
Updated on
One of the most well-known debugging tools for developers is undoubtedly application logging, which allows us to record timestamped information about the current state of our application. In the OpenTelemetry project, logs are the third and final pillar of observability, along with tracing and metrics.
Let’s dive into logging.
VIDEO: Logging With OpenTelemetry in ASP.NET Core Web API.
What is Logging?
Logs are timestamped records that are either structured or unstructured.
There are a couple of components that make up logs. First, we have the actual message we want to log. This can be anything the developer chooses, but it is generally used to provide more contextual information about an issue that occurred.
Next, we have the severity level to mark our log, known in .NET as the LogLevel. This ranges from simple Debug, which is aimed at use during local development, all the way up to Critical, which is reserved for the worse case scenarios where the application cannot recover from a fault and needs immediate attention.
In OpenTelemetry, logs are any data that is not part of a trace or metric, however, they can be attached to span events.
Unstructured and Structured Logging
There are two general types of logging. Unstructured logging is the simplest form and is most commonly associated with large text files of ordered messages. This is fine for simple scenarios, but searching and filtering these logs is not an easy task.
Structured logging is by far the most recommended solution. This approach treats logs as structured objects in JSON format. This provides much more flexibility in what we can log, such as variables, methods, etc. It also provides much easier searching, filtering, and processing of messages.
Now that we have a better understanding of what makes up logging, let’s look at logging with OpenTelemetry.
Logging in .NET
In .NET, we use the ILogger interface to create log messages. This interface allows us to abstract underlying log providers. Before we look at OpenTelemetry logging, we’ll use the built-in logging functionality to see what it provides us.
To start, let’s create a console application using the dotnet new console command or the Visual Studio Wizard.
We need a couple of NuGet packages to get us started, which are Microsoft.Extensions.Logging and Microsoft.Extensions.Logging.Console.
With these installed, let’s configure our logger in the Program class:
var serviceProvider = new ServiceCollection()
    .AddLogging((loggingBuilder) => loggingBuilder
        .SetMinimumLevel(LogLevel.Debug)
        .AddConsole())
    .BuildServiceProvider();

var logger = serviceProvider.GetRequiredService<ILoggerFactory>().CreateLogger<Program>();
First, we add logging to our application service collection using the AddLogging() method. As we will create log messages from Debug and up, we set the minimum log level using the SetMinimumLevel() method. For now, we’ll log in to the console with the AddConsole() method.
Finally, we create a logger by retrieving an instance of ILoggerFactory from the service provider and calling the CreateLogger() method.
Now that we have our logger instance, let’s create some logs:
logger.LogDebug("This is a {severityLevel} message", LogLevel.Debug);

logger.LogInformation("{severityLevel} messages are used to provide contextual information", LogLevel.Information);

logger.LogError(new Exception("Application exception"), "These are usually accompanied by an exception");
Here, we create three logs of differing levels. Our debug and information logs make use of structured logging to inject variables into placeholders, while our LogError() method takes an exception as the first parameter.
Let’s run our application and see these logs in the console:
dbug: Program[0]
      This is a Debug message
info: Program[0]
      Information messages are used to provide contextual information
fail: Program[0]
      These are usually accompanied by an exception
      System.Exception: Application exception
We see our Debug and Information logs have replaced the severityLevel placeholder with the appropriate log level. Our error log includes the exception that we passed in.
This is a fine start. But we can enhance these logs with OpenTelemetry.
Logging With OpenTelemetry
As we previously saw, we use the ILogger interface to create log messages in .NET. Fortunately, OpenTelemetry uses this interface to manage its logs, so we don’t need to change our existing log messages. We simply need to configure our logger to use OpenTelemetry.
To do this, first, we need to install the OpenTelemetry.Exporter.Console NuGet package.
With this installed, let’s reconfigure our logger:
var serviceProvider = new ServiceCollection()
    .AddLogging((loggingBuilder) => loggingBuilder
        .SetMinimumLevel(LogLevel.Debug)
        .AddOpenTelemetry(options =>
            options.AddConsoleExporter())
        )
    .BuildServiceProvider();
Here, we are still logging to the console, but we do it using the AddConsoleExporter() method.
Let’s run our application again and see what we get now:
LogRecord.Timestamp:               2023-02-12T08:48:14.6472070Z
LogRecord.CategoryName:            Program
LogRecord.LogLevel:                Debug
LogRecord.State (Key:Value):
    severityLevel: Debug
    OriginalFormat (a.k.a Body): This is a {severityLevel} message

Resource associated with LogRecord:
service.name: unknown_service:OpenTelemetryLogging

LogRecord.Timestamp:               2023-02-12T08:48:14.6914117Z
LogRecord.CategoryName:            Program
LogRecord.LogLevel:                Information
LogRecord.State (Key:Value):
    severityLevel: Information
    OriginalFormat (a.k.a Body): {severityLevel} messages are used to provide contextual information

Resource associated with LogRecord:
service.name: unknown_service:OpenTelemetryLogging

LogRecord.Timestamp:               2023-02-12T08:48:14.6920500Z
LogRecord.CategoryName:            Program
LogRecord.LogLevel:                Error
LogRecord.State (Key:Value):
    OriginalFormat (a.k.a Body): These are usually accompanied by an exception
LogRecord.Exception:               System.Exception: Application exception

Resource associated with LogRecord:
service.name: unknown_service:OpenTelemetryLogging
Here, we see much more structured and informative log messages. We receive all the information for the log, such as Timestamp, CategoryName, State as individual properties, along with the service.name which is the name of our application.
Enrich Logs
Now that our logs are using OpenTelemetry to export to the console, let’s look at how we can enrich our log data.
Service Name
The first, and simplest enrichment we can achieve is to add a meaningful service name. Currently, our service name is unknown_service:OpenTelemetryLogging which is pulled from our .NET project name. Let’s improve this:
var serviceProvider = new ServiceCollection()
    .AddLogging((loggingBuilder) => loggingBuilder
        .SetMinimumLevel(LogLevel.Debug)
        .AddOpenTelemetry(options =>
            options.AddConsoleExporter()
                .SetResourceBuilder(
                    ResourceBuilder.CreateDefault()
                        .AddService("Logging.NET")))
        )
    .BuildServiceProvider();
Here, we use the SetResourceBuilder() extension method along with the AddService() method to provide a name for our application.
Now when we run our application, we’ll see our service.name set correctly:
LogRecord.Timestamp:               2023-02-12T09:21:31.7086121Z
LogRecord.CategoryName:            Program
LogRecord.LogLevel:                Information
LogRecord.State (Key:Value):
    severityLevel: Information
    OriginalFormat (a.k.a Body): {severityLevel} messages are used to provide contextual information

Resource associated with LogRecord:
service.name: Logging.NET
service.instance.id: 6ccfd2b5-7ec6-4409-b0c8-621bbfa77ff6
Now our service.name displays Logging.NET correctly. Also, we now get a new property, service.instance.id. This allows us to identify a specific instance of our application should we be running multiple instances, for example behind a load balancer to support high availability.
Logging Scopes
Another enhancement we can provide for our logging is scoping. Scopes allow us to group logical sets of operations so they can be correlated in observability tools.
Let’s have a look at how we can use scopes for grouping log messages. To demonstrate this, we’ll create a simple login functionality, starting with a User record:
public record User(string UserName, string Password);
With our User record defined, let’s create a service to add our login functionality to:
public class UserService : IUserSevice
{
    private static readonly List<User> _users = new()
    {
        new User("codemaze", "Pa$$w0rd!!")
    };

    private readonly ILogger<UserService> _logger;

    public UserService(ILogger<UserService> logger)
    {
        _logger = logger;
    }

    public bool Login(string username, string password)
    {
       using var _ = _logger.BeginScope(new List<KeyValuePair<string, object>>
       {
           new KeyValuePair<string, object>("UserName", username)
       });

        _logger.LogInformation("Searching for user");
        if (_users.Any(u => u.Equals(new(username, password))))
        {
            _logger.LogInformation("User found, logging in");
            return true;
        }

        _logger.LogWarning("User not found");
        return false;
    }
}
Here, we start with a static readonly list of users. Obviously, this is not the best security practice, but for the purposes of this article, it is fine.
Next, we have a _logger property, which we instantiate through the constructor using dependency injection.
Finally, our Login() method simply checks if there is a matching user in our _users list, logging the outcome. We use the BeginScope() method on the _logger property to create a scope, providing the username as a parameter for the state. This ensures any logging done within this scope will have the username attached to it, as we’ll shortly see.
Before we run our application again, we need to register our service with the service collection, and ensure scopes are enabled for our logs:
var serviceProvider = new ServiceCollection()
    .AddLogging((loggingBuilder) => loggingBuilder
        .SetMinimumLevel(LogLevel.Debug)
        .AddOpenTelemetry(options =>
            options.AddConsoleExporter()
                .SetResourceBuilder(
                    ResourceBuilder.CreateDefault()
                        .AddService("Logging.NET"))
                .IncludeScopes = true)
        )
    .AddScoped<IUserSevice, UserService>()
    .BuildServiceProvider();
We set the IncludeScopes property to true, and add our UserService as a scoped service.
Now, we retrieve an instance of our service and attempt to log in:
var userService = serviceProvider.GetRequiredService<IUserSevice>();
userService.Login("codemaze", "Pa$$w0rd!!");
This time, we see our log messages with the scope value for the username:
LogRecord.Timestamp:               2023-02-12T10:02:26.9323620Z
LogRecord.CategoryName:            OpenTelemetryLogging.UserService
LogRecord.LogLevel:                Information
LogRecord.State (Key:Value):
    OriginalFormat (a.k.a Body): Searching for user
LogRecord.ScopeValues (Key:Value):
[Scope.0]:UserName: codemaze

Resource associated with LogRecord:
service.name: Logging.NET
service.instance.id: 4dffd54f-e99f-4609-b369-b160d41b4ad4

LogRecord.Timestamp:               2023-02-12T10:02:26.9468606Z
LogRecord.CategoryName:            OpenTelemetryLogging.UserService
LogRecord.LogLevel:                Information
LogRecord.State (Key:Value):
    OriginalFormat (a.k.a Body): User found, logging in
LogRecord.ScopeValues (Key:Value):
[Scope.0]:UserName: codemaze

Resource associated with LogRecord:
service.name: Logging.NET
service.instance.id: 4dffd54f-e99f-4609-b369-b160d41b4ad4
As we are focusing on logging in OpenTelemetry, we most likely have traces enabled for our application. So next, let’s see how we can correlate our logs with our traces.
Correlate Logs With Traces
When considering the correlation between logs and traces, we need to determine the best identifier of our traces that we can attach to our logs. Fortunately, we have a trace identifier that is perfect for this. Moreover, we also have a span identifier, which allows us to identify individual events within a trace.
A great benefit of OpenTelemetry is that it configures this correlation for us by default. All we need to do is ensure we are using the OpenTelemetry tracing and logging client libraries.
With that, let’s add some simple tracing to our application to see this in action:
var activitySource = new ActivitySource("Logging.NET");

using var traceProvider = Sdk.CreateTracerProviderBuilder()
    .AddSource("Logging.NET")
    .SetResourceBuilder(
        ResourceBuilder.CreateDefault()
            .AddService("Logging.NET")
    .AddConsoleExporter()
    .Build();

// code removed for brevity

using var activity = activitySource.StartActivity("Login");

var userService = serviceProvider.GetRequiredService<IUserSevice>();
userService.Login("codemaze", "Pa$$w0rd!!");
To start, we create a new ActivitySource, which allows us to create new activities, which correspond to traces/spans in .NET. Next up, we use the OpenTelemetry SDK to configure our tracing, using the CreateTraceProviderBuilder() method, ensuring to add our activitySource object as a source for retrieving trace data.
Finally, before we retrieve an instance of our UserService and call the Login() method, we start a new activity (trace) with the StartActivity() method.
Now, let’s run our application and see our correlation in action:
LogRecord.Timestamp:               2023-02-12T11:03:57.8985234Z
LogRecord.TraceId:                 25f8f8f4adef74967777ca3ce286fcc1
LogRecord.SpanId:                  924a25c32507fa12
LogRecord.TraceFlags:              Recorded
LogRecord.CategoryName:            OpenTelemetryLogging.UserService
LogRecord.LogLevel:                Information
LogRecord.State (Key:Value):
    OriginalFormat (a.k.a Body): Searching for user
LogRecord.ScopeValues (Key:Value):
[Scope.0]:UserName: codemaze

Resource associated with LogRecord:
service.name: Logging.NET
service.instance.id: 6ec7bb37-6b68-457a-b8a5-2fefd35be67f

LogRecord.Timestamp:               2023-02-12T11:03:57.9045170Z
LogRecord.TraceId:                 25f8f8f4adef74967777ca3ce286fcc1
LogRecord.SpanId:                  924a25c32507fa12
LogRecord.TraceFlags:              Recorded
LogRecord.CategoryName:            OpenTelemetryLogging.UserService
LogRecord.LogLevel:                Information
LogRecord.State (Key:Value):
    OriginalFormat (a.k.a Body): User found, logging in
LogRecord.ScopeValues (Key:Value):
[Scope.0]:UserName: codemaze

Resource associated with LogRecord:
service.name: Logging.NET
service.instance.id: 6ec7bb37-6b68-457a-b8a5-2fefd35be67f

Activity.TraceId:            25f8f8f4adef74967777ca3ce286fcc1
Activity.SpanId:             924a25c32507fa12
Activity.TraceFlags:         Recorded
Activity.ActivitySourceName: Logging.NET
Activity.DisplayName:        Login
Activity.Kind:               Internal
Activity.StartTime:          2023-02-12T11:03:57.8964575Z
Activity.Duration:           00:00:00.0143877
Resource associated with Activity:
    service.name: Logging.NET
    service.instance.id: 32136626-0bd5-4952-a52f-62885ba35fe4
Here, we still have our two log messages. But this time, they have some new properties attached to them, specifically LogRecord.TraceId and LogRecord.SpanId. Also, we now have a trace event in our console, and if we look at the Activity.TraceId and Activity.SpanId properties, we notice they match the values for our log records.
This allows us to correlate our logging and tracing data, which can be very useful for debugging purposes. We can use visualization tools to allow for easy searching and correlation of this data.
Trace Log Events
Another method to add log data to our traces is to use the Span Event property. This has the benefit of allowing us to see log-like information in our chosen observability tool, as most don’t currently allow ingestion of log data.
Let’s add a trace event to our UserService:
public bool Login(string username, string password)
{
    var currentActivity = Activity.Current;
    currentActivity?.AddEvent(new ActivityEvent("Searching for user"));
    using var _ = _logger.BeginScope(new List<KeyValuePair<string, object>>
    {
        new KeyValuePair<string, object>("UserName", username)
    });
     _logger.LogInformation("Searching for user");
    if (_users.Any(u => u.Equals(new(username, password))))
    {
        _logger.LogInformation("User found, logging in");
        return true;
    }
    _logger.LogWarning("User not found");
    return false;
}
To start, in our Login() method, we access the current trace (activity) by using the Activity.Current property.
Next, using the same information for our first log message, we call the AddEvent() to add a log message to our current trace.
Now, when we use an observability tool such as Jaeger, we see the event added to our trace:
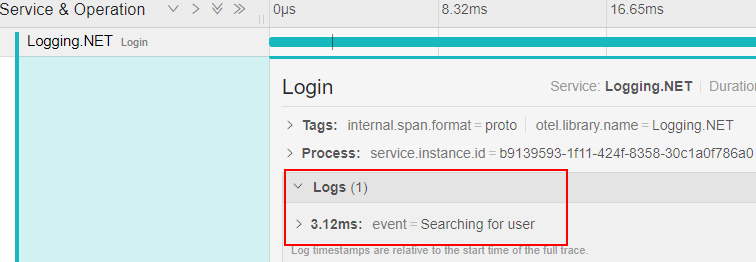
A downside to this method is that, because a lot of applications currently utilize logging, we need to either re-write large parts of our application when we include OpenTelemetry instrumentation, or duplicate log messages, sending them to both a log provider and attaching them to traces to send to an observability tool.
Fortunately, there is a cleaner way to achieve the same functionality, without having to re-write large parts of our application. OpenTelemetry uses processors which run custom code on our data before sending it to an observability tool.
Custom Log Processor
To start, let’s create our own processor to intercept our log data and add it to the current trace if it exists:
public class ActivityEventLogProcessor : BaseProcessor<LogRecord>
{
    public override void OnEnd(LogRecord data)
    {
        base.OnEnd(data);
        var currentActivity = Activity.Current;
        currentActivity?.AddEvent(new ActivityEvent(data.State.ToString()));
    }
}
We create a custom processor by inheriting from the BaseProcessor<T> class. In this case, we want to intercept the LogRecord class.
Next, we override the OnEnd() method and retrieve the current activity (trace). By using the null conditional operator, we add a new event to the current activity using the AddEvent() method, as we previously saw. We access the current log message from the data.State property.
The final thing to do is add this processor to our OpenTelemetry configuration:
var serviceProvider = new ServiceCollection()
    .AddLogging((loggingBuilder) => loggingBuilder
        .SetMinimumLevel(LogLevel.Debug)
        .AddOpenTelemetry(options =>
            options.AddConsoleExporter()
                .SetResourceBuilder(
                    ResourceBuilder.CreateDefault()
                        .AddService("Logging.NET"))
                .AddProcessor(new ActivityEventLogProcessor())
                .IncludeScopes = true)
        )
    .AddScoped<IUserSevice, UserService>()
    .BuildServiceProvider();
We call the AddProcessor() method, passing in a new instance of our custom processor.
Now, we can remove the AddEvent() method call in our Login() method, and run our application again.
This time, in Jaeger, we see all our logs as events in the trace:
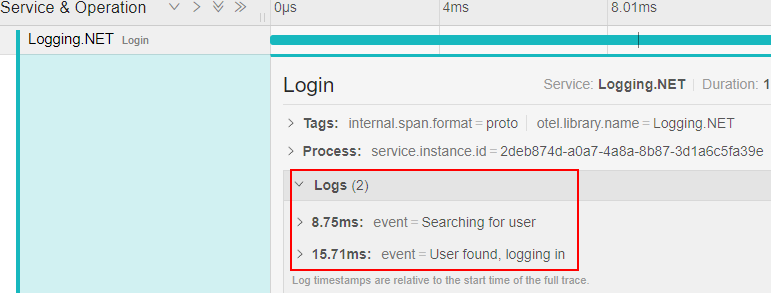
This is a much cleaner solution as we don’t need to alter any existing code to add events to our application.
Conclusion
Logging is one of the most ubiquitous aspects when developing applications.
In this article, we saw how we can plug our existing application logging into OpenTelemetry, as well as enrich our log data with more useful information.
Finally, when working with OpenTelemetry, we usually instrument our applications with tracing, so we looked at how to correlate our existing logging with tracing, to enhance our debugging skills and gain better insight into the performance and state our of applications.