

In this article, we are going to look at a core need of every application out there: logging. We will look at how the excellent library Serilog helps us configure structured logging for applications in a flexible and modern way.
Let’s dive into it.
VIDEO: Structured Logging With Serilog in ASP.NET Core Web API.
Why Is Logging Important?
In today’s world, we build a variety of applications, including:
- Web sites
- APIs
- Serverless applications
- Background processes (e.g Windows services)
One thing common to them all is the need for logging.
Logging can be used for the following reasons:
- Provide a breadcrumb trail of activity leading up to an event (good or bad)
- Help supplement exception information recorded in other systems
- Understand how clients use our application
- Record application metrics
What Is Structured Logging?
In older logging systems, log messages were simply strings, e.g.:
OrderId: 10 placed successfully.
Structured logging is a modern approach where logging events are treated as structured data rather than text, for example:
{ “payload”: { “order”: { “id”: 10 }, “message”: “OrderId: 10 placed successfully” }
The content is similar, but the difference is the attributes have been identified and structured so that a system that understands these types of logs can perform special operations on the logs, such as filtering log messages for a particular orderId.
Why Serilog?
In the .NET space, there are 3 big players:
- NLog
- log4net
- Serilog
Comparing the features of all three is outside the scope of this article, but the main reason for choosing Serilog is that because it’s newer than the other two, it supports structured logging out of the box, while the others require some configuration. There is also a lot more recent support for Serilog in the community, leading to a lot of extensions and logging sinks.
Setting Up Serilog
In this article, we will set up Serilog for use in an ASP.NET Core web application. Most of the techniques here can be applied to any .NET application, but the ASP.NET Core setup will yield a few more interesting concepts, that’s why we’ll install a special additional package for that.
Creating a new ASP.NET Core Web Application
First off, let’s go ahead and create a new ASP.NET Core Web Application (Razor Pages) using Visual Studio.
To prepare for logging output, let’s make Kestrel the default web server by updating launchSettings.json:
{
  "profiles": {
    "WebApplication": {
      "commandName": "Project",
      "dotnetRunMessages": "true",
      "launchBrowser": true,
      "applicationUrl": "https://localhost:5001;http://localhost:5000",
      "environmentVariables": {
        "ASPNETCORE_ENVIRONMENT": "Development"
      }
    }
  }
}
If we hit CTRL-F5, we’ll see the default web application template and the log output in the command window:
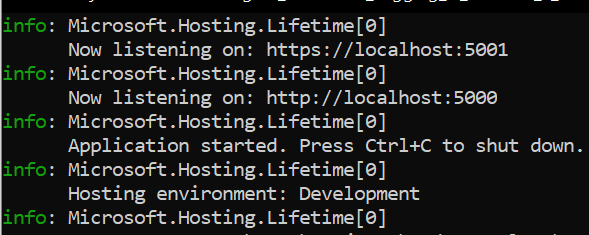
This confirms that our app is working with the default logging enabled, which we will contrast with Serilog logging.
Let’s proceed to configure Serilog.
Configuring Serilog
The easiest way to install Serilog into our ASP.NET Core application is by installing the Serilog.AspNetCore NuGet package:
PM> Install-Package Serilog.AspNetCore
This will install the core Serilog bits, a few default sinks, and some code tailored for ASP.NET.
Next, we need to configure Serilog in the web host. To do that, let’s modify the Main method in Program.cs:
public static void Main(string[] args)
{
    Log.Logger = new LoggerConfiguration()
        .WriteTo.Console()
        .CreateLogger();

    try
    {
        Log.Information("Starting web host");
        CreateHostBuilder(args).Build().Run();
    }
    catch (Exception ex)
    {
        Log.Fatal(ex, "Host terminated unexpectedly");
    }
    finally
    {
        Log.CloseAndFlush();
    }
}
We configure the following behavior:
- Set up a static Log.Logger instance
- Write output to the Console
- Add some basic logs, capturing any errors
Nothing too exciting just yet, but it’s coming! 🙂
To continue, let’s modify the CreateHostBuilder method:
public static IHostBuilder CreateHostBuilder(string[] args) =>
    Host.CreateDefaultBuilder(args)
        .UseSerilog()
        .ConfigureWebHostDefaults(webBuilder =>
        {
            webBuilder.UseStartup<Startup>();
        });
This configures Serilog as the default logging provider.
Configuration in .NET 6 Without the Startup Class
If you are using the standard template from .NET 6, you don’t have the Startup class, but only the Program class. In that case, the configuration is a bit different:
using Serilog;

Log.Logger = new LoggerConfiguration()
    .WriteTo.Console()
    .CreateLogger();

try
{
    Log.Information("Starting web host");

    var builder = WebApplication.CreateBuilder(args);

    builder.Services.AddControllers();

    builder.Host.UseSerilog((ctx, lc) => lc
        .WriteTo.Console());

    var app = builder.Build();

    app.UseHttpsRedirection();

    app.UseAuthorization();

    app.MapControllers();

    app.Run();
}
catch (Exception ex)
{
    Log.Fatal(ex, "Host terminated unexpectedly");
}
finally
{
    Log.CloseAndFlush();
}
In the rest of the article, we are going to use the Startup class example, but you can easily extend the builder.Host.UseSerilog method with additional configuration.
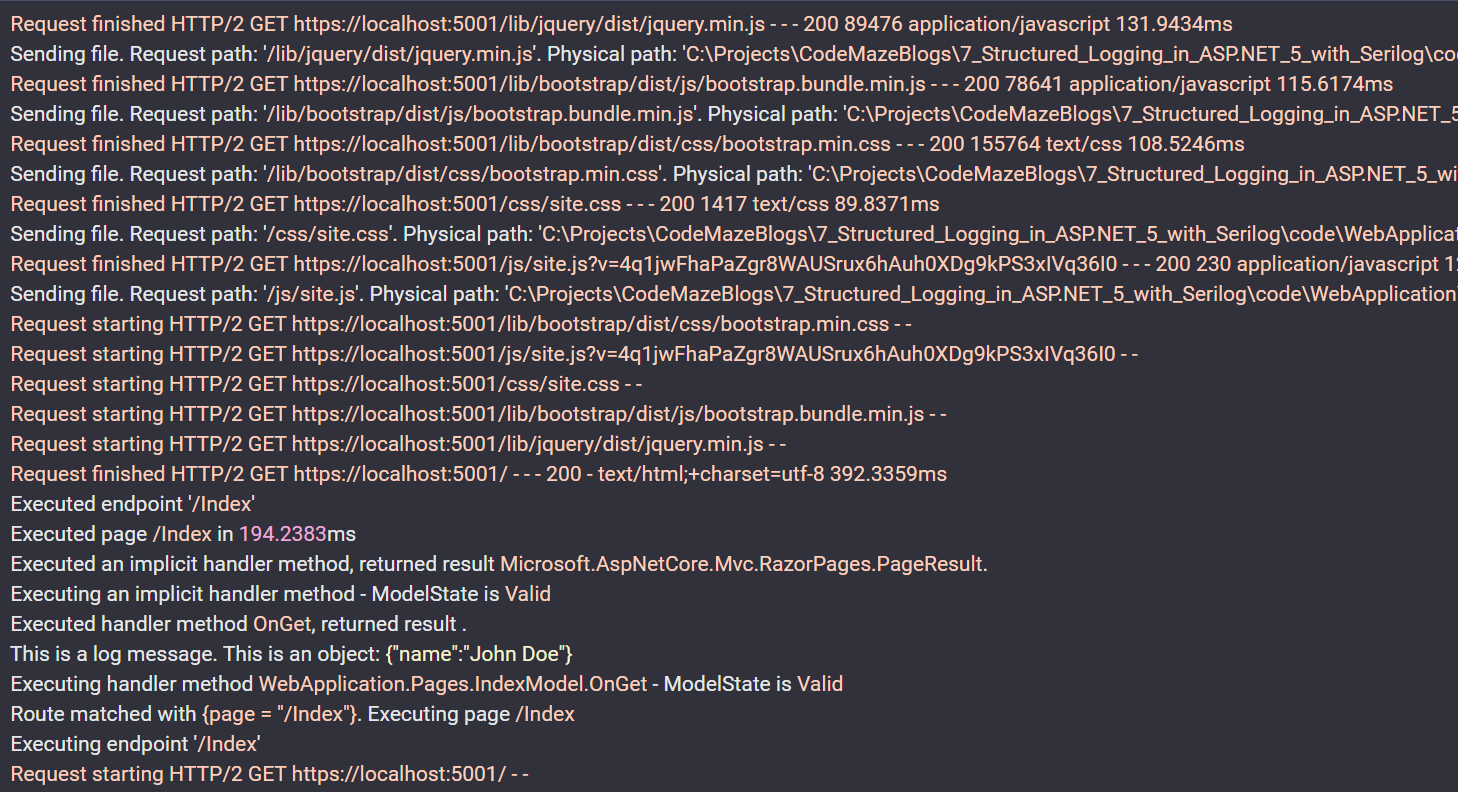
If we hit CTRL-F5 again to run our app, we are going to see more logging:
As we can see, Serilog captures the logging omitted by the internals of the application and outputs it to the console.
In the next section, we’ll update our application to log some events.
Writing Some Log Events
So far we’ve only seen the default log events being output to the console window. Now, let’s see how we can add custom log events.
Let’s open up the Index.cshtml.cs file and modify OnGet():
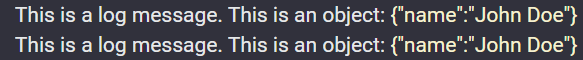
_logger.LogInformation("This is a log message. This is an object: {User}", new { name = "John Doe" });
If we hit CTRL+F5, we see our log message:
![]()
This is normal logging in action. But if want to create structured logs, we have to use the format.
So, let’s modify the configuration:
Log.Logger = new LoggerConfiguration()
    .WriteTo.Console(new JsonFormatter())
    .CreateLogger();
With the format added, we can start our app again:
{
  "Timestamp": "2022-05-12T10:43:02.8081779+02:00",
  "Level": "Information",
  "MessageTemplate": "This is a log message. This is an object: {User}",
  "Properties": {
    "User": "{ name = John Doe }",
    "SourceContext": "WebApplication.Pages.IndexModel",
    "ActionId": "cf235faa-07ae-4597-905f-e5eb227c4479",
    "ActionName": "/Index",
    "RequestId": "0HMHJUDMEO5FS:00000001",
    "RequestPath": "/",
    "ConnectionId": "0HMHJUDMEO5FS"
  }
}
This time, we can see a JSON form of our log message with all the properties.
In the next section, we are going to look at adding some additional sinks that include the ability to filter on these special attributes.
Configuring Additional Sinks
In this section, we are going to look at how to configure additional sinks with Serilog, to view and analyze logging data in different ways. There are too many sinks available to list, but we are going to look at a few popular and useful ones.
Seq
A great tool to view structured logs is Seq. There is a free version that we can install on local machines, so let’s jump over to the download page and install Seq. We have to download it, install it, and set it up by running the program.
Now that we’ve got Seq installed, let’s install the Serilog sink:
PM> Install-Package Serilog.Sinks.Seq
Then modify our logging configuration:
Log.Logger = new LoggerConfiguration()
    .WriteTo.Console()
    .WriteTo.Seq("http://localhost:5341")
    .CreateLogger();
If we run our application again, we not only see our logging in the Kestrel console output, but we also see it in Seq:
If we click on our custom log message, we can see all the individual structured attributes:
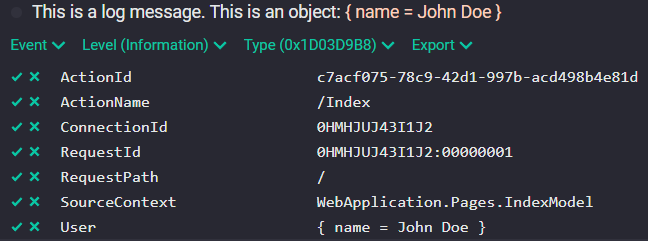
As mentioned earlier, we can query upon any of these fields if the tool allows it, and luckily enough Seq does.
Let’s add the following text to the query section in Seq:
User = '{ name = John Doe }'
If we hit enter to execute the search, we should see some log messages matching the query (the number of messages you see will depend on the number of requests you’ve done to the “Index” page”):
As expected, Seq returns log messages matching the search filter. Our example is of course very simple, but consider a more meaningful application with custom attributes and various business events. We could then query upon all of these attributes, allowing us to “sift” through a lot of noise and get to the information we need quickly and easily. Some tools (including Seq) also allow graphing this information, to give even more power to structure logging. This power was never possible with traditional string-based logs.
File
Another useful sink to configure would be the file sink. This one is useful when we are running in an environment like containers, where instead of sending data over HTTP from a bunch of different containers, we can write to a file and then have something else ship these files somewhere.
To set up the File sink, we just need to install the package:
PM> Install-Package Serilog.Sinks.File
Then let’s jump over to our log configuration and configure the new sink:
Log.Logger = new LoggerConfiguration()
.WriteTo.Console(new JsonFormatter())
.WriteTo.Seq("http://localhost:5341")
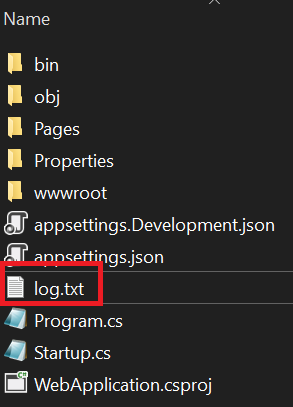
.WriteTo.File("log.txt")
.CreateLogger();
We can also configure how the file should roll over, but for now, let’s leave it as is.
If we run our app again and browse around, we should see a log event written to a file called “log.txt” in the root of our web application on the file system:
Of course, if we want the logs in a JSON format for the structured logs, we have to add the format to the configuration as we did with the Console option:
Log.Logger = new LoggerConfiguration()
    .WriteTo.Console(new JsonFormatter())
    .WriteTo.Seq("http://localhost:5341")
    .WriteTo.File(new JsonFormatter(), "log.txt")
    .CreateLogger();
Now, if we run our app, and inspect the log file, we will see the JSON formatted logs.
That’s all it takes to get file logging working. We can start to see how simple it is to configure additional sinks, once the main bits of Serilog has been wired up.
SQL Server
The last sink we are going to demonstrate is the SQL Server sink. This can be useful if you want to query and analyze your log data using SQL or the associated tools.
To set up logging with SQL Server, yes you guessed it, we just need to install a new sink:
PM> Install-Package Serilog.Sinks.MSSqlServer
Then again we just need to update our logging config:
Log.Logger = new LoggerConfiguration()
    .WriteTo.Console(new JsonFormatter())
    .WriteTo.Seq("http://localhost:5341")
    .WriteTo.File(new JsonFormatter(), "log.txt")
    .WriteTo.MSSqlServer("Data Source=localhost;Initial Catalog=LoggingDb;Integrated Security=SSPI",
                         new MSSqlServerSinkOptions
                         {
                             TableName = "Logs",
                             SchemaName = "dbo",
                             AutoCreateSqlTable = true
                         })
    .CreateLogger();
Here we are simply specifying a local SQL instance as the target, with a table name of “Logs”. Make sure you update the connection string to fit your needs, and you’ll need to create the LoggingDb database if it doesn’t exist. Lots more customization options can be done, which are outside the scope of this article.
If we run our app and browse around, then use query the data in the DB, we see our events:

We’ve demonstrated some of the main sinks we might want to use when implementing logging in .NET applications. Next on, we’ll look at some handy middleware for making ASP.NET Core request logging even better.
ASP.NET Core Request Logging
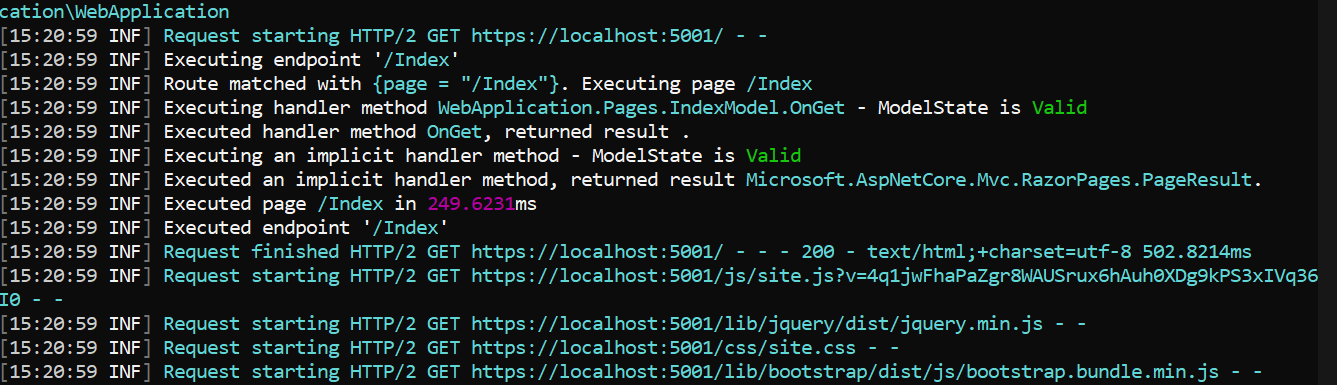
You might have noticed that the built-in request logging events are quite “noisy”:
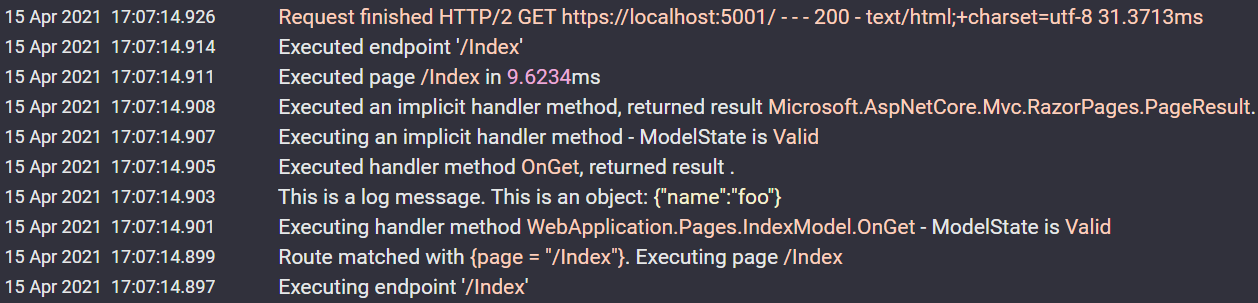
These are the events emitted for a single request to the homepage. The Serilog.AspNetCore package, which we installed at the beginning of this article, helps condense these log events into more manageable information.
First, we need to override the default log level for Microsoft.AspNet logger in our logger config:
Log.Logger = new LoggerConfiguration()
    .WriteTo.Console(new JsonFormatter())
    .WriteTo.Seq("http://localhost:5341")
    .WriteTo.File(new JsonFormatter(), "log.txt")
    .WriteTo.MSSqlServer("Data Source=localhost;Initial Catalog=LoggingDb;Integrated Security=SSPI",
                         new MSSqlServerSinkOptions
                         {
                             TableName = "Logs",
                             SchemaName = "dbo",
                             AutoCreateSqlTable = true
                         })
    .MinimumLevel.Override("Microsoft.AspNetCore", LogEventLevel.Warning)
    .CreateLogger();
Next, we need to configure the middleware. We have to configure this before the MVC handlers so that the events emitted by that middleware are captured.
So, let’s modify the Configure method in the Startup class:
public void Configure(IApplicationBuilder app, IWebHostEnvironment env)
{
    if (env.IsDevelopment())
    {
        app.UseDeveloperExceptionPage();
    }
    else
    {
        app.UseExceptionHandler("/Error");
        // The default HSTS value is 30 days. You may want to change this for production scenarios, see https://aka.ms/aspnetcore-hsts.
        app.UseHsts();
    }

    app.UseSerilogRequestLogging();

    app.UseHttpsRedirection();
    app.UseStaticFiles();

    app.UseRouting();

    app.UseAuthorization();

    app.UseEndpoints(endpoints =>
    {
        endpoints.MapRazorPages();
    });
}
If we run our app now and hit the homepage, we’ll see the difference in the events emitted:
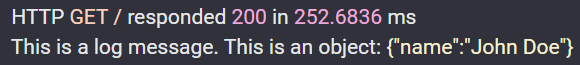
We’ve gone from 9 events for the request down to 1.
If we click on the event in Seq, we’ll see it has a structured logging setup for “Elapsed”, “RequestMethod”, “RequestPath” and “StatusCode”, so we can query on those as needed.
Often these bits of information are “enough” for request logging, so it can cut down on redundant logging, network bandwidth, and storage of the logs. Logging can be quite expensive on many facets of software, so it’s important to be pragmatic and only log what we need.
Conclusion
In this article, we’ve looked at how easy it is to get a structured logging setup with Serilog in ASP.NET Core. Due to the great sinks developed by the community, we’ve seen how easy it is to configure additional sinks.
Problems can and will happen when we release our software to the wild, so it’s imperative we have all kinds of information and metrics available at hand, logging being often the final source of truth when other tools don’t give us the answers we need.
We’ve only touched the surface of the possibilities of Serilog, so we encourage you to read up on the extra things we can do to make logging even better.