

One of the fundamental concepts in the OpenTelemetry project is the ability to observe end-to-end requests through our applications, which is known as tracing. We achieve this by adding custom code to our .NET applications to emit this tracing information, which we can then view in open-source visualization and observability tools.
This article makes use of Docker to run Jaeger and SQL Server locally.
Let’s dive in and learn a bit more about tracing in .NET.
What is Tracing?
Tracing, also known as the 1st pillar of OpenTelemetry, allows us to record the paths users and other applications take when making a request to our application. This request can cross service boundaries, such as talking to a database or other downstream applications, and allows us to determine where issues and failures occur within our applications.
A trace is made up of a set of spans, which is a singular event that occurs within our application. Observability tools, such as Jaeger, allow us to visualize these spans, usually as a waterfall diagram, to easily debug issues.
OpenTelemetry provides a set of client libraries that instruments our .NET applications and emits traces, which we can then send to an observability back-end, so let’s have a look at that next.
Auto Instrumentation of Tracing in .NET
There are a set of built-in client libraries for .NET that allow auto-instrumentation of our applications, including HTTP Requests and SQL client. To start, let’s create a new ASP.NET Core API, either using the Visual Studio Project wizard, or the dotnet new webapi command.
We need a couple of NuGet packages to start, so let’s add OpenTelemetry, OpenTelemetry.Instrumentation.AspNetCore, OpenTelemetry.Exporter.Console and OpenTelemetry.Extensions.Hosting. Now we have enough to start auto-instrumenting our .NET application with tracing.
Note: it is worth mentioning that at the time of writing this article, some of the packages are not in a stable version, so breaking changes may occure.
HTTP Requests
In our Program class, let’s configure OpenTelemetry for our application.
Note: in the latest release of the OpenTelemetry.Extensions.Hosting package, the StartWithHost() method is no longer available. This can be omitted and the code will still work:
builder.Services.AddOpenTelemetry()
    .WithTracing(builder => builder
        .AddAspNetCoreInstrumentation()
        .AddConsoleExporter())
    .StartWithHost(); //with the package latest version, we can omitt this call
Here, we start by calling the AddOpenTelemetry() method, which configures the services required for instrumenting our .NET application. Then, we configure tracing with the AddAspNetCoreInstrumentation() method. This records tracing information for all incoming HTTP requests.
Next, we’ll start by exporting to console, with the AddConsoleExporter() method. Finally, we call the StartWithHost() method, which will start our trace collection.
Let’s run our application and make a request to /WeatherForeceast. If we take a look at the console, we see a trace for our request:
Activity.TraceId:            bd30cd17bab41567148058936b88566b
Activity.SpanId:             2de69bc070adf322
Activity.TraceFlags:         Recorded
Activity.ActivitySourceName: Microsoft.AspNetCore
Activity.DisplayName:        WeatherForecast
Activity.Kind:               Server
Activity.StartTime:          2023-01-01T09:32:26.0862703Z
Activity.Duration:           00:00:00.0268695
Activity.Tags:
    net.host.name: localhost
    net.host.port: 7042
    http.method: GET
    http.scheme: https
    http.target: /WeatherForecast
    http.url: https://localhost:7042/WeatherForecast
    http.flavor: 2.0
    http.user_agent: Mozilla/5.0 (Windows NT 10.0; Win64; x64) AppleWebKit/537.36 Chrome/108.0.0.0 Safari/537.36
    http.route: WeatherForecast
    http.status_code: 200
Resource associated with Activity:
    service.name: unknown_service:Tracing.NET
There’s a lot of information here. This is the benefit of having auto-instrumentation for our applications. We see ids, such as Activity.TraceId and Activity.SpanId. The TraceId property is used to correlate spans so we can view all the events that occurred during a single request. In this case, we only have one, but with multiple downstream events, they would all use the same TraceId.
In the Activity.Tags property, we get some more useful information such http.url, which tells us the URL that was requested, as well as http.status_code, telling us the returned HTTP status code.
Now that our incoming HTTP requests are emitting traces, let’s look at how we emit traces for outgoing HTTP requests.
Outgoing HTTP Requests
In .NET, we use the HttpClient class to make outgoing HTTP requests, so we can configure this to emit tracing events.
To achieve this, let’s add the OpenTelemetry.Instrumentation.Http NuGet package and configure it in our Program class:
builder.Services.AddOpenTelemetry()
    .WithTracing(builder => builder
        .AddAspNetCoreInstrumentation()
        .AddHttpClientInstrumentation()
        .AddConsoleExporter())
    .StartWithHost();
Here, we simply call the AddHttpClientInstrumentation() method to set up traces for outgoing HttpClient requests.
Next, let’s create a new endpoint on our existing WeatherForecast controller to make an outgoing HTTP request:
[HttpGet("OutgoingHttp")]
public async Task OutgoingHttpRequest()
{
    var client = new HttpClient();

    var response = await client.GetAsync("https://code-maze.com");
    response.EnsureSuccessStatusCode();
}
In our new endpoint, we simply instantiate a new HttpClient and make a GET request to create a trace.
Now, let’s run our application and make a request to /WeatherForecast/OutgoingHttp. Checking our console, we see a new trace emitted:
Activity.TraceId:            a84c88ba397869403f20ff237a335974
Activity.SpanId:             ef640b94d30c1ac1
Activity.TraceFlags:         Recorded
Activity.ParentSpanId:       2c1c14c7f9342953
Activity.ActivitySourceName: System.Net.Http
Activity.DisplayName:        HTTP GET
Activity.Kind:               Client
Activity.StartTime:          2023-01-14T07:42:10.2261354Z
Activity.Duration:           00:00:00.2452441
Activity.Tags:
    http.scheme: https
    http.method: GET
    net.peer.name: code-maze.com
    http.url: https://code-maze.com
    http.flavor: 1.1
    http.status_code: 200
Resource associated with Activity:
    service.name: Tracing.NET
    service.instance.id: fc7f1aad-e7d7-48ed-8bd9-d7a7b00aaab0
This looks very similar to our previous, incoming HTTP trace. But there are a couple of slight differences. First, our ActivitySourceName tag value is different, as this is generated by the HttpClient class. Secondly, Activity.Kind has a value of Client this time. This follows the OpenTelemetry trace standards and lets us know this is an outgoing remote call.
With both incoming and outgoing HTTP requests covered, let’s look at emitting traces for SQL client requests.
Tracing SQL Commands
More often than not, our applications need some form of data persistence, and when working in .NET, SQL is usually the database of choice. Fortunately, there is a client library for OpenTelemetry that provides us with auto-instrumentation, allowing us to gather tracing information for SQL client connections.
To start, let’s spin up a SQL server docker container using the docker run command:
docker run -e "ACCEPT_EULA=Y" -e "SA_PASSWORD=P@$$w0rd!!" -p 1433:1433 --name sql --hostname sql -d mcr.microsoft.com/mssql/server:2019-latest
We won’t cover all the setup required to configure Entity Framework Core in this article.
To demonstrate SQL client tracing in .NET, let’s add a Product class:
public class Product
{
    public int Id { get; set; }
    public string Name { get; set; }
    public string Description { get; set; }
    public decimal Price { get; set; }
}
We’ll seed some data so that we don’t have to create the logic to do so in our application:
protected override void OnModelCreating(ModelBuilder modelBuilder)
{
    modelBuilder.Entity<Product>()
    .HasData(
        new Product
        {
            Id = 1,
            Name = "Mechanical Keyboard",
            Description = "RGB mechanical keyboard with Cherry MX Red switches",
            Price = 99.99M
        },
        new Product
        {
            Id = 2,
            Name = "Gaming Mouse",
            Description = "RGB gaming mouse with 7 programmable buttons",
            Price = 69.99M
        }
    );
}
Next, let’s create a ProductsController:
[ApiController]
public class ProductsController : ControllerBase
{
    private readonly ProductsDataContext _dataContext;

    public ProductsController(ProductsDataContext dataContext)
    {
        _dataContext = dataContext;
    }

    [HttpGet]
    public async Task<IEnumerable<Product>> GetProducts()
    {
        return await _dataContext.Products.ToListAsync();
    }
}
We inject our ProductsDataContext into the class constructor and use it in our GetProducts() method to return the list of Products. This is enough to demonstrate the SQL client tracing.
The final step is to add the SQL instrumentation configuration in our Program class:
builder.Services.AddOpenTelemetry()
    .WithTracing(builder => builder
        .AddAspNetCoreInstrumentation()
        .AddHttpClientInstrumentation()
        .AddSqlClientInstrumentation()
        .AddConsoleExporter())
    .StartWithHost();
To access the AddSqlClientInstrumentation() method, we add the OpenTelemetry.Instrumentation.SqlClient NuGet package.
Now we’re ready to view the traces for our SQL client. Running our application and making a GET request to /api/products, we see the SQL trace in our console window:
Activity.TraceId:            33f23be6c6ac368482632f307100e504
Activity.SpanId:             1b1ace1b8b06ea95
Activity.TraceFlags:         Recorded
Activity.ParentSpanId:       21a68faa2a5e0d10
Activity.ActivitySourceName: OpenTelemetry.Instrumentation.SqlClient
Activity.DisplayName:        Products
Activity.Kind:               Client
Activity.StartTime:          2023-01-01T11:07:57.6306137Z
Activity.Duration:           00:00:00.0308308
Activity.Tags:
    db.system: mssql
    db.name: Products
    peer.service: localhost
    db.statement_type: Text
Resource associated with Activity:
    service.name: unknown_service:Tracing.NET

info: Microsoft.EntityFrameworkCore.Database.Command[20101]
      Executed DbCommand (46ms) [Parameters=[], CommandType='Text', CommandTimeout='30']
      SELECT [p].[Id], [p].[Description], [p].[Name], [p].[Price]
      FROM [Products] AS [p]

Activity.TraceId:            33f23be6c6ac368482632f307100e504
Activity.SpanId:             21a68faa2a5e0d10
Activity.ActivitySourceName: Microsoft.AspNetCore
Activity.DisplayName:        api/Products
Activity.Kind:               Server
Activity.StartTime:          2023-01-01T11:07:56.0895809Z
Activity.Duration:           00:00:01.6693710
Activity.Tags:
    net.host.name: localhost
    net.host.port: 7042
    http.method: GET
    http.scheme: https
    http.target: /api/Products
    http.url: https://localhost:7042/api/Products
We see the SQL instrumentation library provides us with some handy information, such as the actual SQL command that was executed by Entity Framework Core, as well as the db.name.
Also, what we now see are 2 spans created for our request to /api/products, one is our SQL client span and the other is the HTTP request we previously configured. If we look at the Activity.TraceId property for both, we see they are the same value. This allows us to correlate related spans for a single request.
Setup Jaeger for Visualization
So far, we’ve simply logged traces to the console. However, this isn’t very easy to visualize. So let’s look at a better way to achieve this, using the observability tool Jaeger.
To start using Jaeger locally, we can make use of docker:
docker run -d --name jaeger -p 16686:16686 -p 6831:6831/udp jaegertracing/all-in-one:1.21
We need to open two ports to our container. First, 16686 is the frontend UI that we will use to view our traces. The other port, 6831/udp is a UDP port that will allow Jaeger to accept jaeger.thrift traces over the compact thrift protocol.
Next, we need to configure our application to export traces to Jaeger. For this, we need a new NuGet package, OpenTelemetry.Exporter.Jaeger. With this package, we configure OpenTelemetry to export to Jaeger in our Program class:
builder.Services.AddOpenTelemetry()
    .WithTracing(builder => builder
        .AddAspNetCoreInstrumentation()
        .AddHttpClientInstrumentation()
        .AddSqlClientInstrumentation()
        .AddConsoleExporter()
        .AddJaegerExporter())
    .StartWithHost();
And that’s all! Let’s run our application again and make a request to /api/products. This time, instead of looking at the console output for our traces, we’ll navigate to http://localhost:16686, which will show the Jaeger interface:
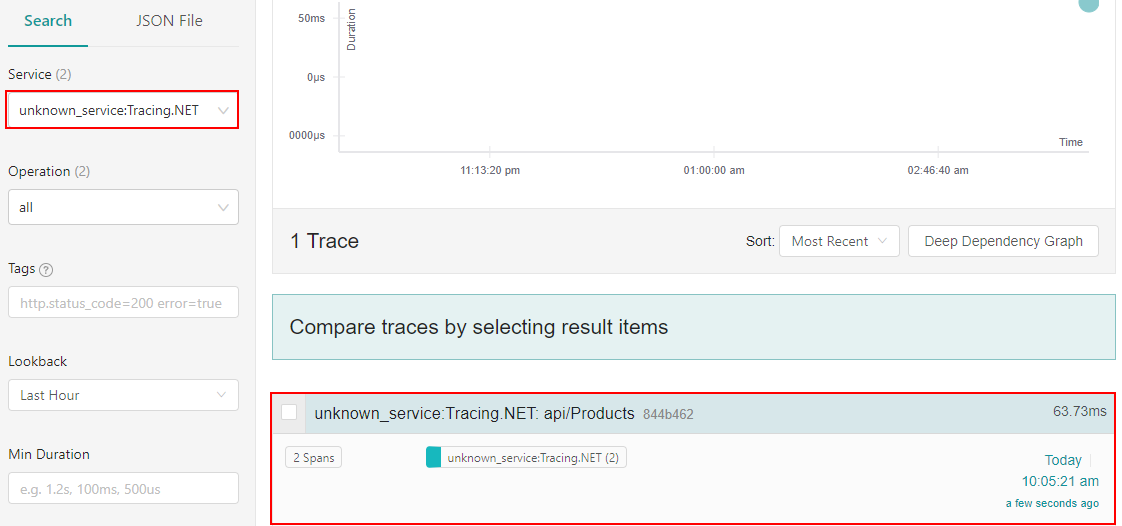
If we filter by our .NET project name, we will see our trace representing our request to api/Products. We can click on this trace to get more details about each span that makes up this trace:
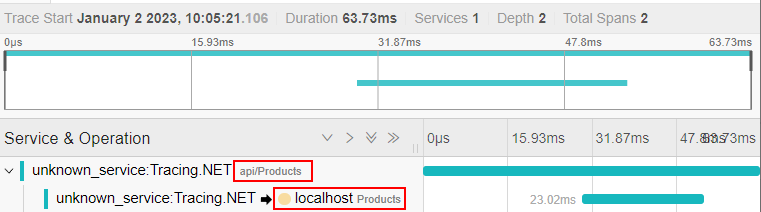
Jaeger handles the visualization of associated spans, based on the TraceId that we saw earlier. We see both the HTTP request to api/Products and the SQL client connection to our Products database, along with the duration of each activity and the overall time for the trace.
As we can see, the auto-instrumentation provides us with quite a lot of information. However, we usually need to add custom fields and events to our applications to capture specific business events, so let’s look at that next.
Manual Tracing Instrumentation in .NET
In .NET, OpenTelemetry uses the ActivitySource class to create traces and spans. This is the class we use to create custom events, add tags and properties to our spans, and create our own spans.
Add Custom Spans
If we want to track custom activities in our application, beyond what we get from the auto-instrumentation libraries, we want to create custom spans. To start, let’s add a new method that will be called from our GetProducts() method:
private static List<Product>? _products;

[HttpGet]
public async Task<IEnumerable<Product>> GetProducts()
{
    if(CheckCache(out var products))
    {
        return products;
    }

    _products = await _dataContext.Products.ToListAsync();
    return _products;
}

private static bool CheckCache(out IEnumerable<Product> products)
{
    if (_products is not null)
    {
        products = _products;
        return true;
    }

    products = new List<Product>();
    return false;
}
Here, we add a very simple in-memory cache object, _products, that we’ll check using the CheckCache() method before attempting to retrieve the products from the database.
Now, we need to use the ActivitySource class to create our custom span:
private static readonly ActivitySource _activitySource = new("Tracing.NET");

// code omitted from brevity

private static bool CheckCache(out IEnumerable<Product> products)
{
    using var activity = _activitySource.StartActivity("CheckCache");
    if (_products is not null)
    {
        products = _products;
        return true;
    }
    products = new List<Product>();
    return false;
}
First, we create a new ActivitySource object. We provide it with a name, which we usually name after the application or service. In our CheckCache() method, we start a new activity, with the using keyword that will scope this variable to our method.
The final step is to let OpenTelemetry know to use this ActivitySource to send traces to Jaeger:
builder.Services.AddOpenTelemetry()
    .WithTracing(builder => builder
        .AddAspNetCoreInstrumentation()
        .AddHttpClientInstrumentation()
        .AddSqlClientInstrumentation()
        .AddConsoleExporter()
        .AddJaegerExporter()
        .AddSource("Tracing.NET")
        .SetResourceBuilder(
            ResourceBuilder.CreateDefault()
                .AddService(serviceName: "Tracing.NET"))
    .StartWithHost();
By using the AddSource() method, we tell OpenTelemetry to include this source when sending traces to Jaeger. Also, we can use a friendlier name for our service in Jaeger with the SetResourceBuilder() method.
Let’s run our application and make a request to /api/products. The first time we make this request, our cache will be empty, so we need to go to the database to retrieve the list of products. We can verify this in Jaeger:
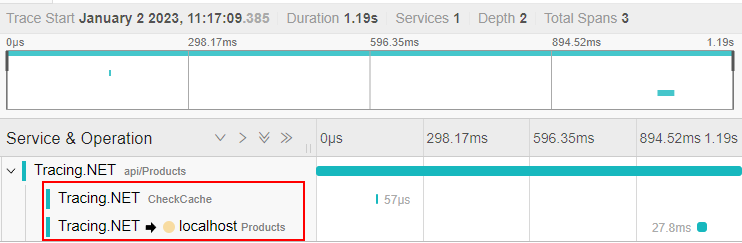
First off, we see that our service name is much clearer now. Secondly, we can confirm our cache is initially checked, but the product list is empty, so we go to our database to retrieve them.
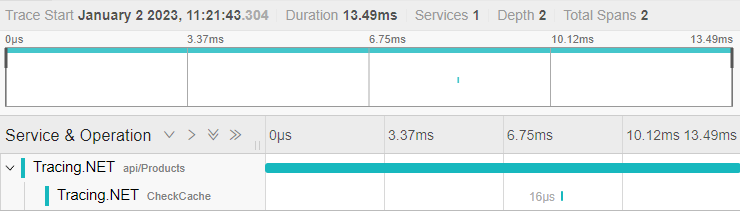
Making a second request to our endpoint, we no longer check the database, and instead pull the list from our cache:
Add Tags
Suppose we want to keep track of some useful information about our cached products list, such as how many items are currently in the cache. We can achieve this by adding custom tags to our span activity:
if (_products is not null)
{
    activity.SetTag("products.count", _products.Count);
    products = _products;
    return true;
}
We’ve already seen tags in action with the auto-instrumentation libraries, such as the http.url or db.name. This time, we add a tag products.count which will appear on our CheckCache span:
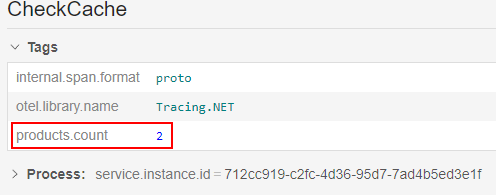
This is useful for providing more context for a given span. Also, many of the observability tools, such as Jaeger, allow us to search spans with a specific tag/value pair.
Baggage
Tags are only associated with a single span, but what if we want to send information to child spans easily? This is where Baggage comes in handy. Baggage allows us to add contextual information to a span/trace. Child spans, which may or may not cross boundaries to another service, have access to this information.
Let’s add a UserId to our baggage context for incoming HTTP requests, which can be accessed in child spans:
builder.Services.AddOpenTelemetry()
    .WithTracing(builder => builder
        .AddAspNetCoreInstrumentation(opt =>
        {
            opt.EnrichWithHttpRequest = (activity, httpRequest) => activity.SetBaggage("UserId", "1234");
        })
Here, we intercept the activity that gets created for incoming HTTP requests and set the UserId baggage item.
Now we can access this baggage item in our child spans:
private static bool CheckCache(out IEnumerable<Product> products)
{
    using var activity = _activitySource.StartActivity("CheckCache");

    var userId = Activity.Current.GetBaggageItem("UserId");
    activity.AddTag("UserId", userId);

    // code removed for brevity
}
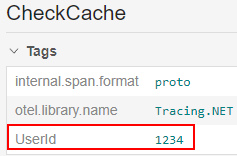
We use the Activity.Current property to access the current HTTP request activity, using the GetBaggageItem() method to retrieve the value of the UserId. Then, we use the SetTag() method like we’ve previously seen.
A lot of the observability tools do not have built-in support for displaying baggage values, so we use the existing tag functionality to see it in Jaeger:
Events
As we’ve seen, spans provide a lot of contextual information for a request or operation in our applications, such as UserIds, HTTP status codes, database queries, etc. So far we’ve only used them to capture a single operation, but we can go a step further and track secondary scenarios representing a meaningful point in time. We achieve this with Span Events.
In .NET, span events are represented with the ActivityEvent struct. Let’s add an event to our CheckCache() method:
private static bool CheckCache(out IEnumerable<Product> products)
{
    using var activity = _activitySource.StartActivity("CheckCache");
    if (_products is not null)
    {
        var activityEvent = new ActivityEvent("ProductsRetrievedFromCache",
            tags: new ActivityTagsCollection{new ("products.count", _products.Count)});
        activity.AddEvent(activityEvent);
        products = _products;
        return true;
    }
    products = new List<Product>();
    return false;
}
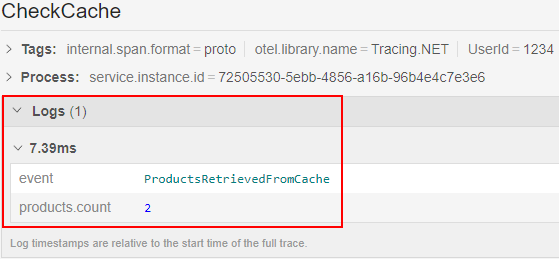
This time, we use the AddEvent() method to create a timestamped event letting us know when we retrieve the _products list from the cache. Events allow us to add optional tags, so we set the products.count tag as part of the event, instead of as part of the activity.
Now, when we run our application and make a request to /api/products twice, to populate our cache, we see the newly created event as part of our existing span:
Conclusion
Tracing is one of the fundamental concepts when building observable applications. In this article, we saw how to create basic tracing in .NET. Then we explored some of the more advanced features to enhance our tracing.