

Being able to debug our applications in an efficient manner is a very important aspect when it comes to designing and building applications. In a world of microservices, it becomes harder and harder to reason about our applications and where the source of a bug or issue may lie.
This is where a concept such as OpenTelemetry comes into play, allowing us to instrument our applications and export telemetry data to help us analyze the performance of our applications.
With that, let’s start.
Observability
Before we start to explore OpenTelemetry in-depth, let’s cover a fundamental, related topic – observability.
When talking about observability in relation to software applications, it is the concept of being able to understand and reason about our systems from the outside, without needing to necessarily understand the inner workings of each piece of the application. It allows us to ask questions such as “Why is this happening?” and piece together seemingly unrelated data points to determine the root cause of performance issues in our application.
This is not a trivial feature to implement in our applications. But fortunately, this is where OpenTelemetry comes into play.
OpenTelemetry
OpenTelemetry is a set of concepts, standards, and tools to instrument our applications to help make them more observable. It is a Cloud Native Computing Foundation Project, meaning it is open-source and driven by an evergrowing community, including support from the likes of Microsoft, Amazon, and Google to name but a few.
OpenTelemetry aims to create a set of standards for instrumenting applications, making it trivial to move from one tool to another.
Telemetry refers to the data we emit from our applications, relating to their behavior and performance. This breaks down into the 3 pillars; Traces, Metrics, and Logs.
Pillar 1: Traces
Traces, sometimes known as distributed traces, record the paths taken by a request, which could be initiated by a user of our application, or another application. Traces propagate between service boundaries to downstream services. They allow us to piece together the end-to-end journey through our application. This journey can compose of many different small services, message brokers, databases, etc.
Tracing is an essential aspect when being able to observe our applications and make reasonable assumptions as to the cause of a bug or performance issue.
Spans
One or more spans make up a trace. We call the first span in a trace or request the Root Span. This span represents the start to finish of a request. Any events that occurred during this, which are represented as spans, sometimes referred to as Child Spans.
So what is a Span?
A span represents a unit of work or an operation in our application. It tracks specific events made by a user or applications, allowing us to paint a picture of what happened during that request. A span contains a plethora of data, known as span attributes, such as a name, the time it took to complete, and other metadata related to that specific event type. For example, a span relating to an HTTP request will contain information such as the URL being requested, the HTTP method, the response status code, and much more.
When using an observability tool to visualize and investigate our traces, they usually present them in a waterfall diagram:
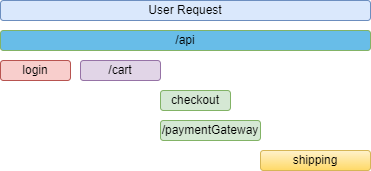
This allows us to easily visualize all the events that happened during a given user request, and dig deeper into specific spans.
Trace ID
Spans need some way to associate with a trace. Requests which propagate through different services need a way to associate with each other. The Trace ID is the property that helps with this in OpenTelemetry. Observability tools use this unique identifier to piece together all related spans. Each new trace (root span) creates a new trace ID to add to each child’s span during its lifetime. Each span also contains a span ID, which allows us to uniquely identify each event within a trace.
Example Trace
Now we understand the components that make up a trace, let’s see what one actually looks like.
A trace is simply a large JSON object, made up of one or more spans:
{
    "name": "Initial Request",
    "trace_id": "7cee3f33312b3dbq1b2c1c92bb7afe2d",
    "span_id": "086e83747d0e381e"
    "parent_id": null
    "start_time": "2022-10-22 08:03:01.109458162 +0000 UTC",
    "end_time": "2022-10-22 08:07:01.109458162 +0000 UTC",
    "attributes": {
        "http.route": "/",
        "http.scheme": "https",
        "http.host": "localhost",
        "http.method": "GET"
    }
}
{
    "name": "Login",
    "trace_id": "7cee3f33312b3dbq1b2c1c92bb7afe2d",
    "span_id": "026q86747d0e211e"
    "parent_id": "7cee3f33312b3dbq1b2c1c92bb7afe2d"
    "start_time": "2022-10-22 08:03:03.109458162 +0000 UTC",
    "end_time": "2022-10-22 08:03:06.109458162 +0000 UTC",
    "attributes": {
        "http.route": "/api/login",
        "http.scheme": "https",
        "http.host": "localhost",
        "http.method": "POST"
    },
    "events": [
         "name": "login attempt"
         "message": "successful",
         "timestamp": "2022-10-22 08:03:04.109458162 +0000 UTC"
    ]
}
Each span contains contextual information, such as a name and a set of identifiers. The first span Initial Request is the start of the user request and therefore does not have a parent_id as it is the root span. The second span, Login is a child span and is associated with the trace by setting both the trace_id.
The parent_id property also points to the root span, but this would not always be the case. Child spans can have their own children, and this is where the parent_id property would be used to ensure the hierarchical structure of the trace and its child spans is built correctly.
All of this information is very helpful when it comes to debugging bugs or performance issues in our applications.
Traces in .NET
In .NET, we can create traces and spans using the ActivitySource class from the System.Diagnostics namespace. This class provides us with methods to create new spans, otherwise known as Activities in .NET.
Let’s see how we create traces:
public class Traces : IPillar
{
    private static readonly ActivitySource _activitySource = new("OpenTelemetry");

    public async Task Start()
    {
        using var activity = _activitySource.StartActivity("Start method");
        await ChildMethod();
    }

    private async Task ChildMethod()
    {
        using var activity = _activitySource.StartActivity("Child method");
        await Task.Delay(500);
    }
}
Following best practices, the ActivitySource should be long-lived. Usually, we scope it to a service or library.
In the Start() method, we call the StartActivity() method on the _activitySource to retrieve and start a new activity. All activities should use a using block, so that it’s safely disposed of when complete. As this is the first activity we create, it will act as the root span.
Then, we call the ChildMethod() method, which creates its own activity. This activity is within our previous activity, so it is a child span, with a link back to our parent. This allows visualization tools to piece together related spans in the waterfall graph as we saw previously.
Pillar 2: Metrics
Metrics are aggregations of numeric data over a given period of time. We can measure applications and their underlying infrastructure. Metrics are important indicators for the availability and performance of our application, allowing us to quickly determine if we are experiencing issues due to factors such as high memory or CPU usage.
We can use these metrics to alert on an outage or trigger autoscaling of resources to address bottlenecks. There are some standard application metrics, such as HTTP request/response times, CPU, and memory usage. We can also provide our own, business-specific metrics, to define important measurements of the availability of our application. For example, the number of purchases of a given product, etc.
Instruments
The OpenTelemetry standards define three metric instruments as of the time of this article:
- Counter: a value that is summed over time. This value only ever increases, it does not decrease.
- Measure: a value that is aggregated over time. This is most useful when measuring the timing of things.
- Observer: captures a current set of values at a particular point in time.
Example
When it comes to metrics, looking at the raw measurements is usually not very useful. To get the most benefit from using metrics, we collect an aggregation of data points over a given time period and use a visualization tool such as Prometheus or Azure Monitor to create graphs that allow us to analyze our application performance.
Let’s assume we have the measure instrument, that aggregates values over time. A typical use case for this instrument would be measuring the request duration of HTTP requests to/from our application. We can start a timer just as we are about to make an HTTP request to https://code-maze.com, then stop the timer when we receive a response. We leave this instrument to take measurements over a period of time, ending up with a set of results:
RequestDuration (ms)
    Url=https://code-maze.com,Percentile=50                          145
    Url=https://code-maze.com,Percentile=95                          192
    Url=https://code-maze.com,Percentile=99                          192
By using the measure instrument, we can bucket measurements into percentiles. Using the above results, we can say that 99% of requests to https://code-maze.com take 192ms or less. This information is useful in our applications as we can quickly determine if requests to our application are degraded or performing poorly. We can export this data into a visualization tool to create dashboards that are much easier to interpret than raw data points.
Metrics in .NET
Once again, we can instrument metrics in .NET from the System.Diagnostics namespace. This time, we use the Meter class to create the types of instruments we want to use:
public class Metrics
{
    private readonly HttpClient _httpClient;
    private static readonly Meter _meter = new("OpenTelemetry");

    public Metrics(HttpClient httpClient)
    {
        _httpClient = httpClient;
    }

    public async Task Start()
    {
        var histogram = _meter.CreateHistogram<float>("RequestDuration", unit: "ms");

        var uri = "https://code-maze.com";

        for (int i = 0; i < 100; i++)
        {
            var stopWatch = Stopwatch.StartNew();
            await _httpClient.GetStringAsync(uri);

            histogram.Record(stopWatch.ElapsedMilliseconds, tag: KeyValuePair.Create<string, object?>("Url", uri));
        }
    }
}
Just like in our ActivitySource class when we looked at traces, it’s best practice to create the Meter class as a static variable scoped to a library or service. This gives us access to create instruments for collecting metrics, which we do by calling the CreateHistogram() method, providing a name for the instrument and an optional unit.
Then, to record measurements, we use the Record() method on the histogram object, providing the measurement, in this case, the elapsed time of the stopwatch, along with some optional tags.
Pillar 3: Logs
Logs are probably the component any application developer is most familiar with. Applications produce these timestamped messages. Unlike traces, they aren’t necessarily associated with any given request or user interaction. They usually come in two flavors, either structured or unstructured.
Structured logging is usually the preferred method of logging, which defines a consistent message format that allows for easier searching and includes additional contextual information to the log event.
While logs are ubiquitous in our applications, alone they aren’t extremely useful for tracking code execution during a request. With OpenTelemetry, we can attach logs to spans to provide better contextual information, such as what happened before the log event to cause a bug or issue in the application.
Example
Structured log messages contain two core components; the log message, and metadata to provide more context around the log event:
{
    "Timestamp": "2022-12-04T10:02:46.7553548+00:00",
    "Level": "Information",
    "MessageTemplate": "Starting request to {Url}",
    "Properties": {
        "Url": "https://code-maze.com"
    }
}
Here, we see the MessageTemplate, which is the template we define when creating the log message, passing in the Url property, which replaces the {Url} component in the message template. We have contextual information, such as the Timestamp and the Level of log this particular message is.
Logging in .NET
Logging in .NET is achieved with the ILogger interface. Most logging frameworks, such as Serilog or NLog implement this interface, so we don’t need to rely on their concrete implementations. It provides us with a bunch of methods depending on the level of logging we want to provide:
public class Logging
{
    private readonly ILogger _logger;

    public Logging(ILogger logger)
    {
        _logger = logger;
    }

    public async Task Start()
    {
        var url = "https://code-mae.com";
        _logger.Information("Starting request to {Url}", url);
    }
}
We use the Information() method to log an informational message to our chosen output. The first parameter is our message template, wrapping any strings we want to replace with {}. The next parameter is a params object[], meaning we can pass multiple parameters here. In this case, we are only passing the url object, which will then replace the {Url} placeholder in the message template.
Conclusion
Observability in the context of our applications is critically important for determining the root cause of bugs and performance issues. In this article, we covered this concept and how we can build more observable applications with the help of OpenTelemetry. This includes the 3 pillars; tracing, metrics and logs.

Nice Article. We are thinking to use OpenTelemetry , but we are using Serilog for logging and Microsoft Telemetry as a metric client for traces/metrics . Can this open telemetry repalce both and provide a generic way to handle Metrics,Traces,logs or what could be the best approach in this case?
So in order to make use of metrics, do we nees to wrap every HttpClient call in Metrics class? Or can we somehow just turn metrics on without any changes to our code?
Hi Vali, if we are only using the built-in functionality given to us through the
System.Diagnosticsnamespace, then yes we would need to wrap every HttpClient call to get metrics such as the request duration.However, OpenTelemetry has some great client libraries that can handle this for us, specifically the OpenTelemetry.Instrumentation.Http NuGet package. Keep an eye out for an upcoming Code Maze article where we take a deeper dive into this.