

In this article, we are going to explore the topic of code coverage in .NET and look at what tools we can use to understand and improve code coverage in the software we build.
Let’s jump right into some basic theory on code coverage.
Theory on Code Coverage
Before we jump into the technical details, it’s worth spending a moment understanding the theory behind code coverage and why it’s important in software development.
What Is Code Coverage?
Code coverage is a metric that we can use to understand how well our code is covered by tests. These metrics are usually discovered by code analysis tools that run through our source code lines, and cross-reference them against the tests that hit these various code paths.
One caveat and often a hotly debated topic about code coverage is how ‘valuable’ these metrics are. Because it simply checks which lines of code are crossed by tests and not actually the value of the tests themselves, you could get great coverage by writing bad tests. Some might argue it’s more valuable to have less coverage but with the right tests. We’re not going to debate that here, as it’s a subjective topic not meant for this blog. Code coverage simply gives you more data about your code, which you can use to make decisions that work for you and your team. How you use that data is of course up to you.
Why Is Code Coverage Important?
Because Code Coverage reports on how well our code is covered by tests, it can arguably be used to improve software quality. Without code coverage, there might be areas in our code that are untested and therefore bugs could slip through the cracks. By exposing these gaps, we can gain more confidence in the software we build.
As we will learn a bit later on, we can then put these reports in our build and release systems to gate code before it progresses along the release process.
Code Coverage Tools in .NET
There are few tools in the .NET space, some popular ones include:
- OpenCover
- dotCover
- Coverlet
In this article, we will be utilizing Coverlet to generate code coverage, as it’s currently the most popular tool in the .NET space and works cross-platform.
Creating a Simple Project
Code coverage can work on any type of code/app. To keep things simple, let’s create a basic class library and test project.
To start off, let’s create a new .NET 5.0 class library project in Visual Studio, and then let’s add a new class called Calculator.cs:
public class Calculator
{
    public int Add(int one, int two)
    {
        return one + two;
    }

    public int Subtract(int one, int two)
    {
        return one - two;
    }
}
We can use this calculator class as our basis for experimenting with code coverage.
Now, let’s add a new xUnit Test Project in Visual Studio to the solution.
If we peek at the .csproj file for the test project, we’ll see the following section:
<PackageReference Include="coverlet.collector" Version="1.3.0">
  <IncludeAssets>runtime; build; native; contentfiles; analyzers; buildtransitive</IncludeAssets>
  <PrivateAssets>all</PrivateAssets>
</PackageReference>
The xUnit test project template in Visual Studio comes pre-configured with the coverlet collector package, so we don’t need to install anything extra.
Let’s add a project reference from our class library to our test project, then add a using statement to UnitTest1.cs:
using CodeCoverageSample;
Generating Code Coverage
Let’s build the solution, open a new terminal, and from the root folder of the solution, run the dotnet test command with a special param:
dotnet test –collect:”XPlat Code Coverage”
The collect param tells the dotnet test to collect code coverage. The “collect” param tells the “dotnet test” to collect code coverage.
If we follow the output, we’ll see:
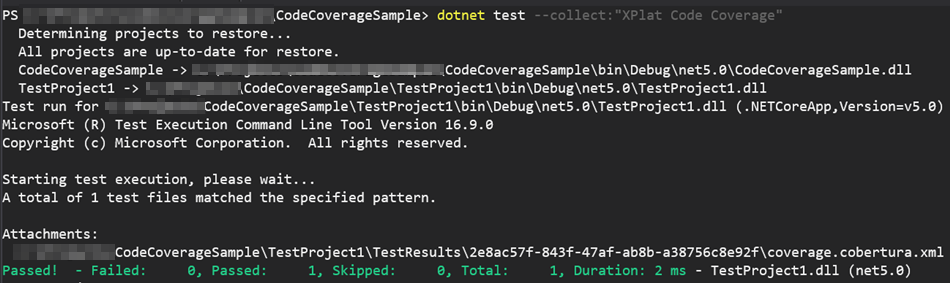
The interesting things to call out are:
- We’ve run dotnet test, which has found the single test (which has passed)
- An “attachment” has been created called “coverage.cobertura.xml”
The “coverage.cobertura.xml” file is the code coverage file.
Coverlet supports a few different formats, which we can read up on another time. But for now, let’s stick with the default format.
If we open the file, we’ll see some interesting data:
<?xml version="1.0" encoding="utf-8"?>
<coverage line-rate="0" branch-rate="1" version="1.9" timestamp="1628389853" lines-covered="0" lines-valid="6" branches-covered="0" branches-valid="0">
  <sources>
    <source>C:\</source>
  </sources>
  <packages>
    <package name="CodeCoverageSample" line-rate="0" branch-rate="1" complexity="2">
      <classes>
        <class name="CodeCoverageSample.Calculator" filename="Projects\CodeCoverageSample\CodeCoverageSample\Calculator.cs" line-rate="0" branch-rate="1" complexity="2">
          <methods>
            <method name="Add" signature="(System.Int32,System.Int32)" line-rate="0" branch-rate="1" complexity="1">
              <lines>
                <line number="6" hits="0" branch="False" />
                <line number="7" hits="0" branch="False" />
                <line number="8" hits="0" branch="False" />
              </lines>
            </method>
            <method name="Subtract" signature="(System.Int32,System.Int32)" line-rate="0" branch-rate="1" complexity="1">
              <lines>
                <line number="11" hits="0" branch="False" />
                <line number="12" hits="0" branch="False" />
                <line number="13" hits="0" branch="False" />
              </lines>
            </method>
          </methods>
          <lines>
            <line number="6" hits="0" branch="False" />
            <line number="7" hits="0" branch="False" />
            <line number="8" hits="0" branch="False" />
            <line number="11" hits="0" branch="False" />
            <line number="12" hits="0" branch="False" />
            <line number="13" hits="0" branch="False" />
          </lines>
        </class>
      </classes>
    </package>
  </packages>
</coverage>
There are a few things to call out:
- The total “lines-valid” is set to 6. This matches the 3 lines for our “Add” method, and 3 lines for our “Subtract” method
- The total “lines-covered” is set to 0. This is as expected since we don’t have any tests yet. We’ll look at adding those next.
- There are some mentions of “branches”. Code coverage is generated based on the lines hit, as well as “branches”, which is if our code has statements that have if / else / switch for example, which can result in different paths of execution. We’ll test those out shortly too.
Adding Tests
Next, let’s add a new test class called CalculatorTests.cs, implementing the tests as we’d expect the behavior to occur:
public class CalculatorTests
{
    private readonly Calculator _calculator = new Calculator();

    [Fact]
    public void GivenTwoNumbers_Add_ReturnsTheTwoNumbersAddedTogether()
    {
        var one = 1;
        var two = 2;

        var actual = _calculator.Add(one, two);

        Assert.Equal(3, actual);
    }

    [Fact]
    public void GivenTwoNumbers_Subtract_ReturnsTheFirstNumberSubtractedFromTheSecond()
    {
        var one = 1;
        var two = 2;

        var actual = _calculator.Subtract(one, two);

        Assert.Equal(-1, actual);
    }
}
If we run the same dotnet test command as before, and inspect the new “coverage.cobertura.xml” file, we see different results:
<?xml version="1.0" encoding="utf-8"?>
<coverage line-rate="1" branch-rate="1" version="1.9" timestamp="1628390252" lines-covered="6" lines-valid="6" branches-covered="0" branches-valid="0">
  <sources>
    <source>C:\</source>
  </sources>
  <packages>
    <package name="CodeCoverageSample" line-rate="1" branch-rate="1" complexity="2">
      <classes>
        <class name="CodeCoverageSample.Calculator" filename="Projects\CodeCoverageSample\CodeCoverageSample\Calculator.cs" line-rate="1" branch-rate="1" complexity="2">
          <methods>
            <method name="Add" signature="(System.Int32,System.Int32)" line-rate="1" branch-rate="1" complexity="1">
              <lines>
                <line number="6" hits="2" branch="False" />
                <line number="7" hits="2" branch="False" />
                <line number="8" hits="2" branch="False" />
              </lines>
            </method>
            <method name="Subtract" signature="(System.Int32,System.Int32)" line-rate="1" branch-rate="1" complexity="1">
              <lines>
                <line number="11" hits="1" branch="False" />
                <line number="12" hits="1" branch="False" />
                <line number="13" hits="1" branch="False" />
              </lines>
            </method>
          </methods>
          <lines>
            <line number="6" hits="2" branch="False" />
            <line number="7" hits="2" branch="False" />
            <line number="8" hits="2" branch="False" />
            <line number="11" hits="1" branch="False" />
            <line number="12" hits="1" branch="False" />
            <line number="13" hits="1" branch="False" />
          </lines>
        </class>
      </classes>
    </package>
  </packages>
</coverage>
Now we see the “lines-covered” is 6. This effectively means we now have 100% code coverage!
In the next section, we’ll look at pushing the code coverage results to a service called codecov.io, which puts a nice UI on top of the coverage file, and is helpful for integrating into our build processes, which we’ll see a bit later.
Code Coverage Reports in Codecov.io
Codecov.io is a popular commercial tool that lets you get better insights into your code coverage. There are a variety of pricing options outside the scope of this article, but open source code is free, which we’ll use in our example.
Before we continue, you need to sign in to Codecov with your GitHub account. After you do that, we can move on.
Setting Up the Build
The first thing we’ll need to do is push our code up to a public GitHub repository.
After that’s done, we can use the (also free for open-source) GitHub Actions to generate a simple build.
If we click on the Actions tab in our GitHub repository, we’ll see a suggested workflow:
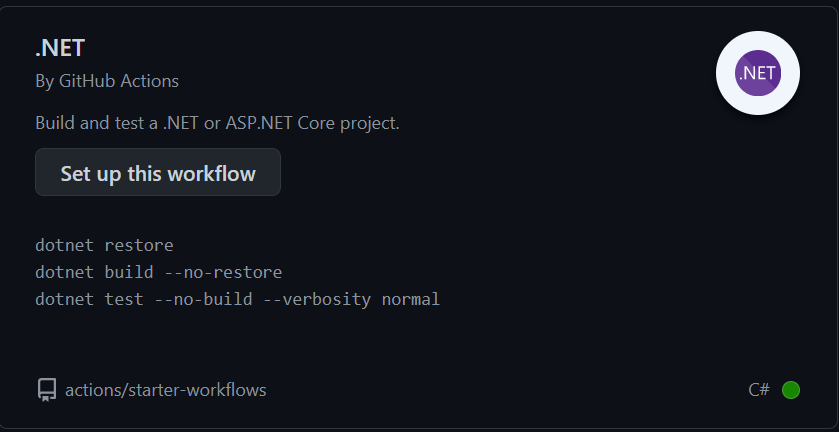
If we click Set up this workflow, GitHub will populate an initial dotnet.yml file for us, which we will override and use the following:
name: .NET

on:
  push:
    branches: [ master ]
  pull_request:
    branches: [ master ]

jobs:
  build:

    runs-on: ubuntu-latest
    defaults:
      run:
        working-directory: CodeCoverageSample

    steps:
    - uses: actions/checkout@v2
    - name: Setup .NET
      uses: actions/setup-dotnet@v1
      with:
        dotnet-version: 5.0.x
    - name: Restore dependencies
      run: dotnet restore
    - name: Build
      run: dotnet build --no-restore
    - name: Test
      run: dotnet test --no-build --verbosity normal --collect:"XPlat Code Coverage"
    - name: Codecov
      uses: codecov/[email protected]
The important highlighted bits are:
- We’re setting the “working-directory” to the location of where our “.sln” file exists (please update this to suit your folder structure)
dotnet testcommand is executed with coverage collection, as before- Utilizing the
codecovaction allows us to push our report tocodecovwith minimal fuss
The rest of the steps in the GitHub Actions build file should be self-explanatory, and feel free to read up more on the GitHub documentation. The Codecov action also has a lot more configuration, but let’s keep the defaults.
Let’s commit that file. Then, if we jump over to the Actions tab again, we are going to see that our new build is running, and eventually succeeds:
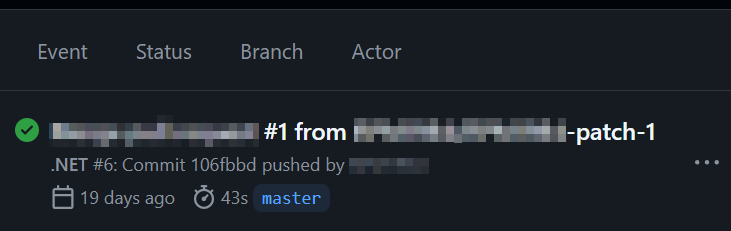
Feel free to jump in and explore what happens behind the scenes of the GitHub Action.
Viewing the Code Coverage Reports
Next, let’s open up the website “codecov.io”. As soon as we sign in with our GitHub account we should see our repository.
If we click through, we should see a graph and a nice green picture:
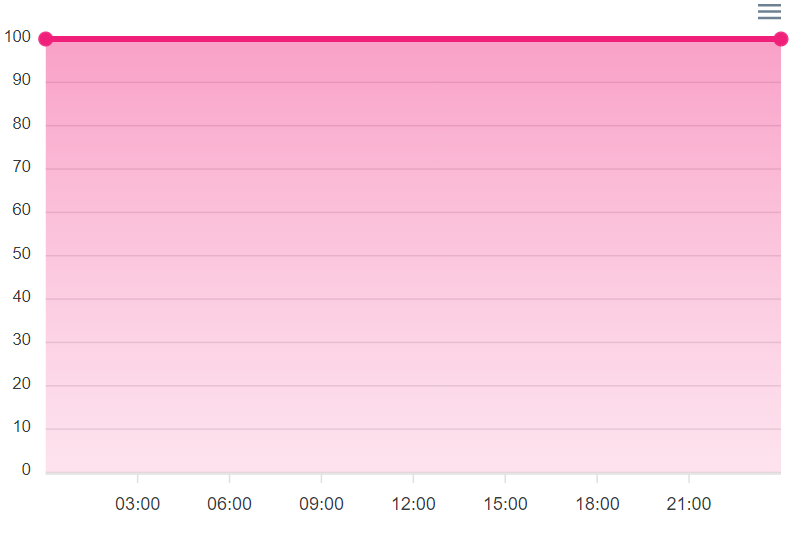
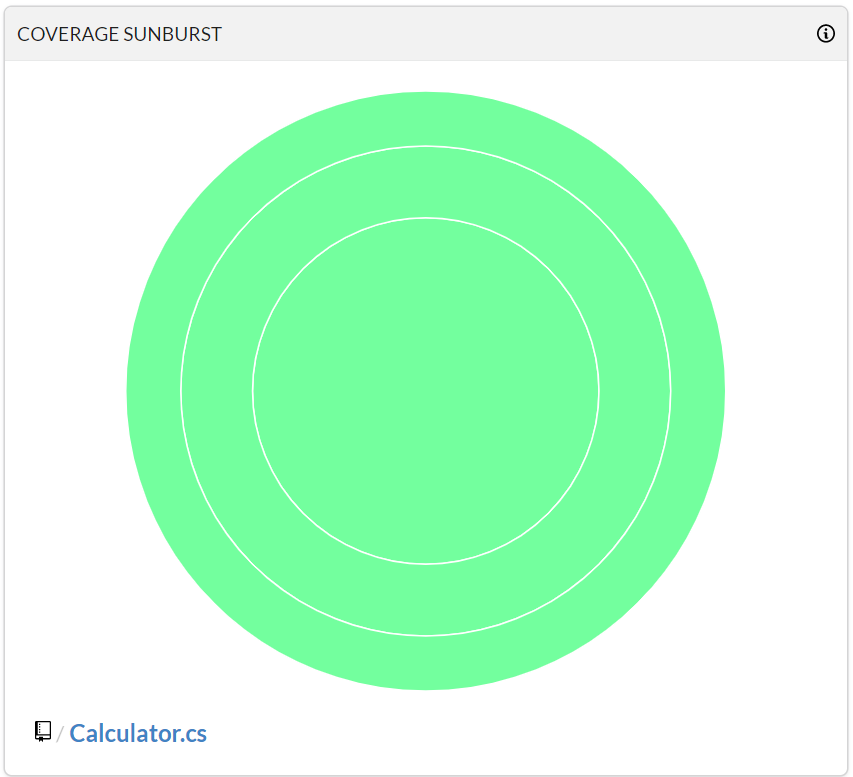
The “coverage” chart will show a timeline of the reports, which are useful to track how our code is going over time. As we expect, our current coverage is 100%.
The “coverage sunburst” is an interactive chart that allows us to look into the layers of our code, to see what’s covered. Feel free to interact with it. The chart becomes more complex as our code does.
Now that we have a nice tool for exploring our code coverage, in the next section, we’ll look at adding a check into our pull requests to ensure new code doesn’t drop coverage.
Quality Gating in CI/CD
In this section, we’ll be looking at how code coverage fits into our quality assurance process. Each team would have its own policies here, but a good recommendation is to ensure that any code should:
a) have adequate tests,
b) not drop overall coverage for the repository.
These are both separate metrics, which are exposed in our code coverage reports respectively.
Creating a Pull Request
To simulate this behavior, let’s open a new pull request on our repository, making a slight modification to the “Add” method:
public int Add(int one, int two)
{
    if (one == 0)
    {
        return 0 + two;
    }

    return one + two;
}
We’re not adding anything meaningful here. The purpose of this change is to demonstrate the effect of branches and to show the difference between “absolute” and “relative” impacts.
Let’s open the pull request, and we see that after GitHub action succeeds, there is some interesting detail on our pull request regarding Codecov:
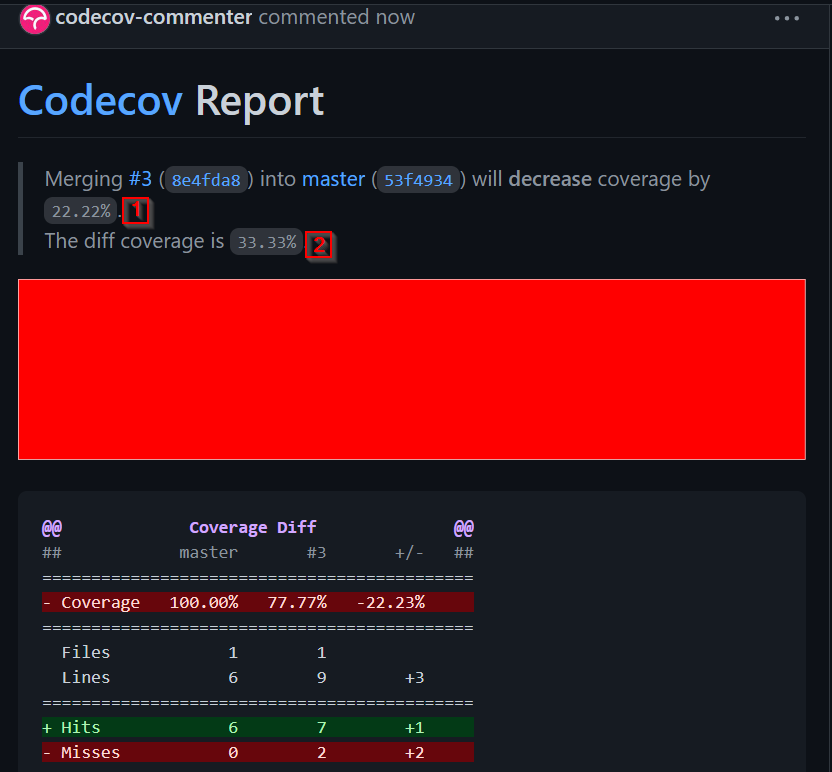
Let’s break down the two highlighted numbers:
- Codecov is saying that by merging this pull request into master, the coverage of our repository will drop 22.22%. You remember that our original coverage was 100%, so this result is an end coverage of 77.77% (as we can see further down in the section). This is known as the “absolute” coverage
- The diff coverage is 33.33%. This means that of the new code we submitted, only 33.33% of that is covered. This is also known as the “relative” coverage.
We can see that the pull request has an overall fail status, due to the new checks in place:
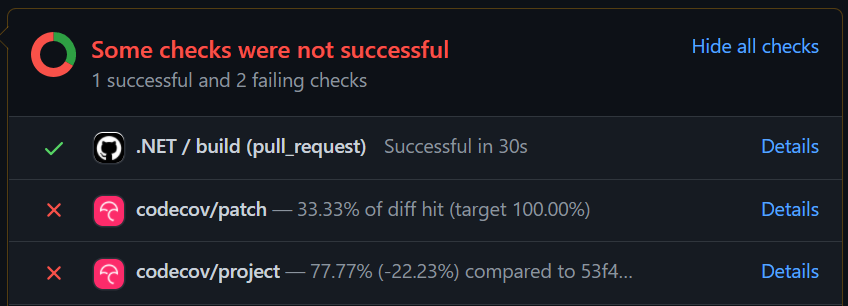
Notice there are two checks that failed:
- “patch”: this corresponds to the “relative” coverage, and we have a target here of 100.00%
- “project”: indicates the 77.77% absolute coverage. The target here is for code coverage to never go down.
The two checks/targets here will ensure that new functionality is properly gated, and doesn’t result in coverage dropping.
Exploring the Coverage Report
Now that we have a report being generated showing numbers dropping, let’s explore the coverage report in codecov and see how we can go about improving things.
Let’s click on the “Continue to review full report at Codecov. link, to open up the report.
On the main screen, we see a big red box. Nothing too exciting. Let’s click on the Diff tab to see more useful information:
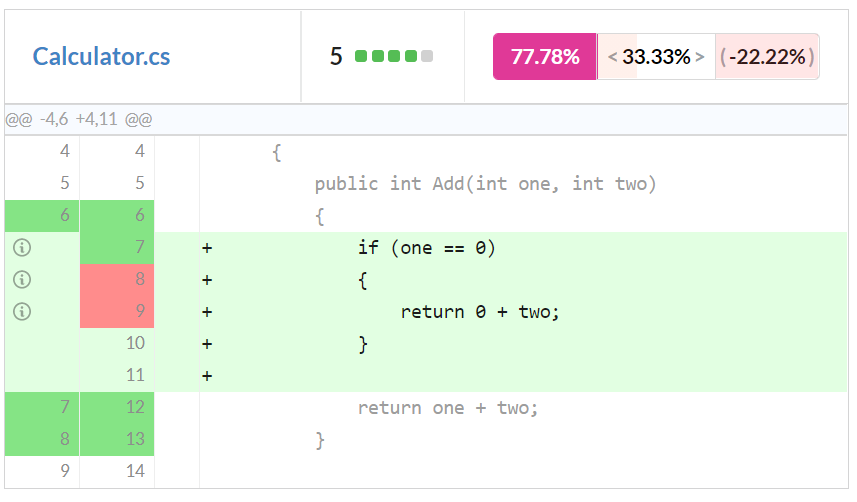
The numbers on the top right are the same as the information on GitHub, no surprises there. What’s interesting is the coloring on the code. The green sections indicate places that we do have coverage for, and the red sections indicate places that we don’t have coverage for.
We see that the new code branch we added is not covered. How is this calculated? As we discussed earlier, code coverage is based on the code executed during tests.
Let’s look at our test for the “Add” method:
[Fact]
public void GivenTwoNumbers_Add_ReturnsTheTwoNumbersAddedTogether()
{
    var one = 1;
    var two = 2;

    var actual = _calculator.Add(one, two);

    Assert.Equal(3, actual);
}
We see that the arguments passed to our “Add” method are 1 and 2. But our new code has an if branch to only execute when the first argument is 0, which is never occurring. Hence the code is not covered. This is of course a contrived example. The code we are adding is not meaningful but we use it to demonstrate the effect of branches on code coverage.
Fixing the coverage
Now that we see why our new code drops the coverage, let’s fix it!
So, let’s convert our test to a Theory, which will test the new if branch:
[Theory]
[InlineData(1, 2, 3)]
[InlineData(0, 2, 2)]
public void GivenTwoNumbers_Add_ReturnsTheTwoNumbersAddedTogether(int one, int two, int expected)
{
    var actual = _calculator.Add(one, two);

    Assert.Equal(expected, actual);
}
If we push this new change up to the existing pull request, as a result, we’ll see our build kicks off again, and the coverage report is re-generated:
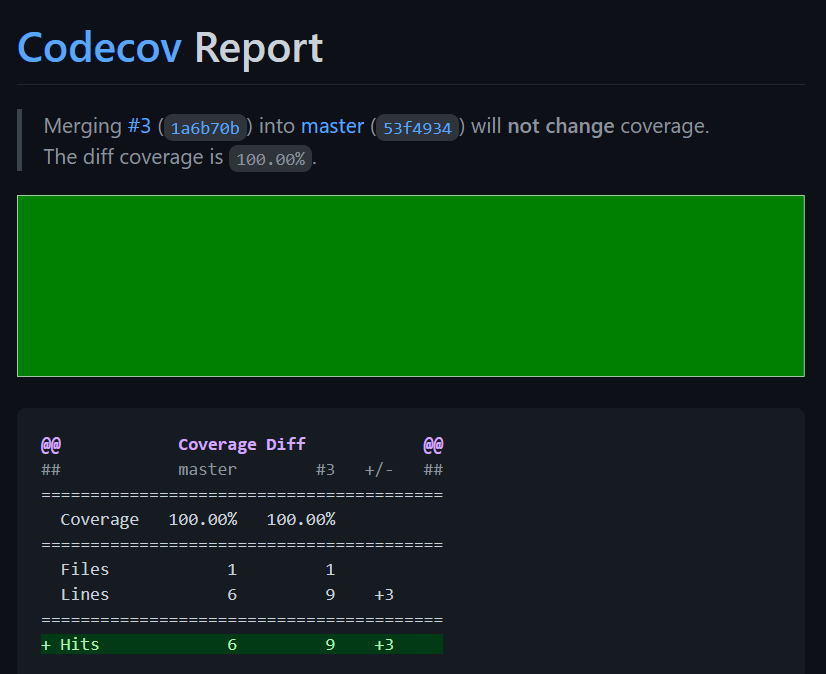
The key points are:
- We have “not changed” coverage (still 100%)
- We’ve added 3 new lines, and the relative coverage of those 3 lines is now 100% (was previously 33.33%)
So, we can now safely merge this new code into our codebase, as we are confident that the quality is up to our standards.
Conclusion
In this article, we have explored the concept of code coverage and why it’s important as a quality gate in our software development process. Just as we want to ensure new code works as expected (functional requirements), performs well (scalability), we can now use it to ensure we have adequate tests for all new code. This becomes particularly important as the codebase grows, as we can use coverage checks to catch potential regressions. Without these coverage reports, we would never know (unless we manually went through the code) what areas of code were not covered by tests and therefore at risk of regression.
Additionally, we’ve shown many of the “default” setups for code coverage. So, feel free to explore the options on coverlet (or your chosen code generation tool), to make it work for you and your team. As with any process, choose what works for you.
Hope you enjoyed this article, happy coding!