

Updated on
In this article, we are going to look into Health Checks in ASP.NET Core. Then we are going to look into the Health Checks Middleware provided by ASP.NET Core to create some checks and add a nice dashboard to view all our Health Checks. Finally, we will briefly look at some ways to make our Health Check endpoints more secure.
This article makes use of Docker to run SQL Server locally, but you can substitute it with your local database.
Let’s dive in.
VIDEO: Health Chekcs in ASP.NET Core Web API.
What Is a Health Check in ASP.NET Core?
Health Checks allow us to determine the overall health and availability of our application infrastructure. They are exposed as HTTP endpoints and can be configured to provide information for various monitoring scenarios, such as the response time and memory usage of our application, or whether our application can communicate with our database provider.
Health Checks are not binary. What if our application is responding, but slower than expected? ASP.NET Core provides us with three different Health Check levels:
- Healthy – our application is healthy and in a normal, working state.
- Unhealthy – our application is unhealthy and is offline or an unhandled exception was thrown while executing the check.
- Degraded – our application is still running, but not responding within an expected timeframe.
Types of Health Checks
When building applications, we can have many dependencies or services that our application requires to perform as expected. There are many different types of Health Checks we can configure:
Basic health probes are the simplest form of health checking. They are configured as a URL endpoint, which will respond with a health response. These basic checks allow us to very quickly determine if our application is healthy or not.
System health checks give us a plethora of information, such as disk storage and memory usage of the underlying host our application is running on.
Database probes can determine whether our database provider is online and whether our application can successfully talk to it. This can be anything from SQL Server, Postgres, Azure CosmosDB, and many more.
Custom health checks can range from anything such as checking a 3rd party service or API our application relies on, to checking our logging storage is not near capacity. These are more general and would require custom code to be written to execute the checks.
These are just some of the Health Checks we can utilize to determine if our application is in a healthy, functioning state.
When Should We Use Health Checks?
When we create Health Checks, we can create very granular, specific checks for certain services, which helps us greatly when diagnosing issues with our application infrastructure, as we can easily see which service/dependency is performing poorly. Our application may still be up and running, but in a degraded state that we can’t easily see by simply using the application, so having Health Checks in place give us a better understanding of what a healthy state of our application looks like.
Instead of relying on our users reporting an issue with the application, we can monitor our application health constantly and be proactive in understanding where our application isn’t functioning correctly and make adjustments as needed.
How to Implement Health Checks in ASP.NET Core Web API?
For this article, we will use an ASP.NET Core Web API to implement Health Checks.
Adding Health Checks Library
Let’s start by creating our ASP.NET Core Web API project. We will need to add a few NuGet packages to start for the Health Checks Middleware:
AspNetCore.HealthChecks.UIAspNetCore.HealthChecks.UI.Client
With these packages added, we will start by adding a very basic Health Check in Program class:
var builder = WebApplication.CreateBuilder(args);

builder.Services.AddHealthChecks();

var app = builder.Build();

app.MapHealthChecks("/health");
First, we create our WebApplicationBuilder.
Next, we add our Health Checks service to our application. We then need to call builder.Build() to get our app instance.
Finally, we map the endpoint /health to access our Health Checks.
With a basic Health Check configured, let’s run our application and navigate to /health, where we will see our application health of Healthy.
This can act as a basic health probe check, to ensure our application is up and responding. We can customize this response to include more information:
app.MapHealthChecks("/health", new HealthCheckOptions
{
    ResponseWriter = UIResponseWriter.WriteHealthCheckUIResponse
});
This time, we include a HealthCheckOptions parameter, and set the ResponseWriter to UIResponseWriter.WriteHealthCheckUIResponse. This uses the built-in response writer from the Health Checks package, but we can create our own response writer should we wish to provide further information.
Once again, we will navigate to /health where we will now see the totalDuration of the request included in the response.
Now that we have set up a basic health probe, let’s look at adding a database Health Check.
Creating Database Health Check
Before we create the Health Check, we need to add the AspNetCore.HealthChecks.SqlServer NuGet package to our project.
With this done, let’s add a check for our database to Program.cs:
builder.Services.AddHealthChecks().AddSqlServer(builder.Configuration.GetConnectionString("DefaultConnection"));
We will need to have a database running locally, which we can do with Docker (a local database will do as well if you’re not familiar with Docker):
docker run -e "ACCEPT_EULA=Y" -e "SA_PASSWORD=MyV3ryStrong@Passw0rd" -p 1433:1433 --name sql --hostname sql -d mcr.microsoft.com/mssql/server:2019-latest
We also need to add a ConnectionStrings section to appsettings.json, using the DefaultConnection key we defined in the Health Check:
"ConnectionStrings": {
    "DefaultConnection": "Data Source=localhost,1433;Initial Catalog=master;User Id=sa;Password=MyV3ryStrong@Passw0rd"
}
The database check is going to execute a SELECT 1 query against the database, which in this case will be executed against the master database.
Running our application and navigating to /health, we will see our database Health Check returning a Healthy status.
We can also simulate our database being offline, or being unable to communicate with our application:
docker stop sql
By executing the docker stop command, we stop our database from running. Now when we refresh our /health page, our database Health Check will return a status of Unhealthy, stating that the timeout period expired when trying to connect.
Creating Custom Health Checks
We can create our own Health Checks, which can execute custom code to check whatever we wish. First, let’s create a class, MyHealthCheck, and implement the IHealthCheck interface:
public class MyHealthCheck: IHealthCheck
{
    public Task<HealthCheckResult> CheckHealthAsync(HealthCheckContext context,
        CancellationToken cancellationToken = default)
    {

    }
}
Now, we’re going to add some logic that will simulate this Health Check providing different response times, to demonstrate the different Health Check results we can expect:
private Random _random = new Random();

public Task<HealthCheckResult> CheckHealthAsync(HealthCheckContext context,
    CancellationToken cancellationToken = default)
{
    var responseTime = _random.Next(1, 300);

    if (responseTime < 100)
    {
        return Task.FromResult(HealthCheckResult.Healthy("Healthy result from MyHealthCheck"));
    }
    else if (responseTime < 200)
    {
        return Task.FromResult(HealthCheckResult.Degraded("Degraded result from MyHealthCheck"));
    }

    return Task.FromResult(HealthCheckResult.Unhealthy("Unhealthy result from MyHealthCheck"));
}
The first thing we add is a new private Random class.
Within our CheckHealthAsync method, we will generate a random responseTime between 1 and 300. We will then check if responseTime < 100 and return a Healthy result.
If responseTime < 200 , this will return a Degraded result. Otherwise, we return an Unhealthy result.
Back in Program.cs, we need to add our new Health Check to our existing checks:
builder.Services.AddHealthChecks()
    .AddSqlServer(builder.Configuration.GetConnectionString("DefaultConnection"))
    .AddCheck<MyHealthCheck>("MyHealthCheck");
Now when we navigate to /health we will not only see our database Health Check but also our custom one, with the status and description we provided. If we refresh the page a few times, we will see different results.
One thing to note now that we have introduced multiple Health Checks is that the overall reported health status of our application will now depend on the combined status of our individual Health Checks. For example, if our database check is Healthy, but our custom check is Unhealthy, our system will report an Unhealthy status overall.
Filtering Health Checks
Now that we have multiple Health Checks, we want an easy way to be able to filter them, possibly by the type of Health Check that is being performed. Fortunately, Health Checks provide tags, which allow us to do just that.
The first thing we want to do is add a tag to both Health Checks:
builder.Services.AddHealthChecks()
    .AddSqlServer(builder.Configuration.GetConnectionString("DefaultConnection"), tags: new[] { "database" })
    .AddCheck<MyHealthCheck>("MyHealthCheck", tags: new[] { "custom" });
Now that we have our tags defined, let’s add a new endpoint, specifically for our Health Checks tagged with custom:
app.MapHealthChecks("/health/custom", new HealthCheckOptions
{
    Predicate = reg => reg.Tags.Contains("custom"),
    ResponseWriter = UIResponseWriter.WriteHealthCheckUIResponse
});
We map a new Health Check endpoint to /health/custom, and this time we add a Predicate delegate to only return Health Checks that include our custom tag.
Now if we navigate to /health/custom, we will see only MyHealthCheck, while our /health endpoint still returns both of our Health Checks.
So far we have been returning an unstyled JSON response from our endpoints. Let’s see how we can make a nice-looking dashboard.
Enhancing Health Checks UI
This new dashboard requires a persistence store, so let’s add the AspNetCore.HealthChecks.UI.InMemory.Storage NuGet package. With that added, let’s add our Health Checks UI in Program.cs:
builder.Services.AddHealthChecksUI().AddInMemoryStorage();
Below our previous AddHealthChecks() method call, we now call AddHealthChecksUI() and use in-memory storage. Next, we need to map this new UI:
app.MapHealthChecksUI();
The final thing we need to do is add some configuration in appsetttings.json, so this new UI knows what endpoints to make requests to for our previously created Health Checks:
"HealthChecksUI": {
  "HealthChecks": [
    {
      "Name": "My Health Checks",
      "Uri": "/health"
    }
  ],
  "EvaluationTimeInSeconds": 5
}
Here, we are defining our /health endpoint, and we set EvaluationTimeInSeconds to 5, which is how frequently we will poll our /health endpoint to run our Health Checks.
Now if we navigate to /healthchecks-ui, we should see a much more friendly interface:
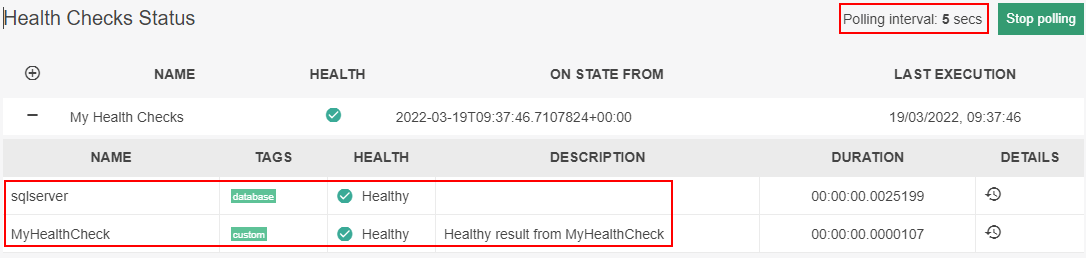
Here, we can see MyHealthCheck and our database Health Checks that we created previously, and the polling interval of 5 seconds.
This UI will refresh every 5 seconds, and with a bit of luck, we should see the Health status of our application changing, depending on the random value generated from MyHealthCheck.
Health Checks Security
We can take advantage of the ASP.NET Core Authorization Middleware to make our Health Check endpoints secure.
Let’s create a secure endpoint for our Health Checks by using the RequireAuthorization method:
app.MapHealthChecks("/health/secure", new HealthCheckOptions
{
    ResponseWriter = UIResponseWriter.WriteHealthCheckUIResponse
}).RequireAuthorization();
This will ensure our /health/secure endpoint uses whatever authorization middleware we have configured for our application.
Adding CORS to Our Health Checks
Although it isn’t common practice to manually run Health Checks by navigating to the UI in the browser, we can enable CORS for our endpoints, by adding RequireCors:
builder.Services.AddCors(opt =>
{
    opt.AddPolicy("MyCorsPolicy", builder =>
    {
        builder.AllowAnyOrigin()
               .AllowAnyMethod()
               .AllowAnyHeader();
    });
});

// other configuration

app.MapHealthChecks("/health/cors", new HealthCheckOptions
{
    ResponseWriter = UIResponseWriter.WriteHealthCheckUIResponse
}).RequireCors("MyCorsPolicy");

app.UseCors("MyCorsPolicy");
First, we add CORS to our application, creating a custom policy, MyCorsPolicy, using a very basic setup. We then need to use this same policy in our RequireCors method for our /health/cors endpoint. Finally, we call the UseCors() method, passing in our policy name to add CORS to the application’s pipeline.
Conclusion
In this article, we’ve learned what Health Checks in ASP.NET Core are and why we should use them in our applications.
After that, we’ve learned how to add a basic Health Check to an ASP.NET Core Web API, along with a database check, and finally a custom one.
Next, we created a clean, user-friendly dashboard to view all our Health Checks.
We finished up by briefly looking at the ways we can secure our health check endpoints, using the ASP.NET Core Authorization Middleware, and finally by adding CORS to make our application more secure.

Suppose I setup a secure heath check endpoint with
And, the azure health probe must now be able to call this health check endpoint.
How would I then configure the azure health check probe so it is able to call this secure health check endpoint.
So, I could always just configure an unsecure health check endpoint for the azure health check probe but I’d prefer not to have an endpoint on my API that is not secure.
How could I access this information from another controller? I have an Api controller for custom health checks that I would like to just add this test to.
Hey David, I’m not sure I entirely understand your question. Are you looking to access this health checks data in another part of your application?
If that’s the case, you could make a request to the /health endpoint from your other controller to receive the raw JSON response. This should do the job. Not sure it’s the most ideal method, but I can’t think of a more straightforward way to achieve what I think you are asking.
Let me know if this isn’t what you are looking to do, and if I misunderstood your question.