When building applications, we try to avoid being tightly coupled to any given third-party service/library, making it harder to switch this implementation with another in the future should the need arise. When working with OpenTelemetry in our applications, we can use the OpenTelemetry Collector to provide a vendor-agnostic tool to export our telemetry data to various observability tools.
This article makes use of Docker to run the OpenTelemetry Collector and Jaeger locally.
With that, let’s dive in!
Observability Tools
Observability tools ingest one or more of the three pillars of telemetry data and allow us to visualize, work with, and reason about the data our applications are producing. They are very powerful and have a plethora of different features, which we won’t cover today.
We usually refer to the tools (backends) we choose for working with our telemetry data as our “observability stack” as more often than not, we end up with more than one tool. For example, we may use Jaeger to visualize our tracing data, Prometheus to collect our application metrics, then Grafana to visualize the data these tools gather in a powerful graphing and dashboard tool, where we can create useful dashboards to give us quick insights into the overall performance of our applications.
OpenTelemetry Collector
As we usually end up with more than one observability tool in our arsenal, we find ourselves writing custom code to export data to these backends, which is not ideal when we want to quickly swap one out for another. That’s where the OpenTelemetry Collector comes into play.
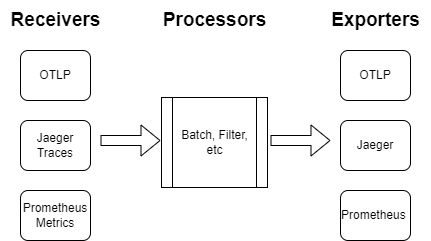
The OpenTelemetry Collector allows us to export our application’s telemetry data into a single agent, run some processing on the data should we wish, and export the data into one or multiple backends:
There are three main components of the Collector:
- Receivers – how we get data into the Collector, which can be either push or pull-based.
- Processors – actions that are run on the data between it being received and exported to a configured observability tool.
- Exporters – how we send telemetry data to one or more backends, which again can be pushed or pull-based.
Of the three components, processors are optional but recommended steps. We need to configure at least one receiver and exporter to successfully send telemetry data to our chosen observability tool.
OpenTelemetry Protocol
Before we start exploring the OpenTelemetry Collector in more detail, we should understand the OpenTelemetry protocol (OTLP). The objective of this protocol is to provide a vendor-agnostic format for telemetry data that can be processed by lots of different observability tools.
Why do we need this new protocol? Well, each of the different observability tools usually comes with its own proprietary data format that we need to use to work with the platform. This means if we have 3 different observability tools, one for each of the pillars, we end up with three different formats of our telemetry data, which isn’t ideal.
The driving force behind the OpenTelemetry project is to provide a ubiquitous framework that allows us to work with a single data format and export this to any observability tool of our choosing, which is exactly what the OTLP format gives us.
Now that we understand the components of the OpenTelemetry Collector and the OTLP, let’s take a look at how we can use them.
Create an Application With Telemetry
To start, let’s create a new console application using the dotnet new console command or Visual Studio Wizard. We need to add a couple of NuGet packages to set up telemetry for our application to export to the Collector, so let’s add the OpenTelemetryand OpenTelemetry.Exporter.Console packages to start. We’ll use these to configure OpenTelemetry instrumentation for our application.
Setup Traces
Tracing is the easiest component to configure and visualize using an observability tool, so let’s set that up for our application in the Program class:
var activitySource = new ActivitySource("OpenTelemetryCollector");

using var traceProvider = Sdk.CreateTracerProviderBuilder()
    .AddSource("OpenTelemetryCollector")
    .SetResourceBuilder(
        ResouceBuilder.CreateDefault()
            .AddService(serviceName: "OpenTelemetryCollector"))
    .AddConsoleExporter()
    .Build();
Here, we create a new instance of the ActivitySource class. This allows us to create new traces (activities). Next, we use the CreateTracerProviderBuilder() method to configure our OpenTelemetry tracing, ensuring we add our activity source with the AddSource() method. For now, we’ll export our traces to the console, just to ensure our tracing is configured correctly.
With our tracing configured, let’s add some simple trace data:
public class Traces
{
    private readonly ActivitySource _activitySource;

    public Traces(ActivitySource activitySource)
    {
        _activitySource = activitySource;
    }

    public async Task LongRunningTask()
    {
        using var activity = _activitySource.StartActivity("Long running task");

        await Task.Delay(1000);

        activity.AddEvent(new ActivityEvent("Long running task complete"));
    }
}
To start, we create a Traces class that takes an ActivitySource as a constructor parameter. Then, we create a LongRunningTask() method. This method simply creates a new activity, waits for a second, then uses the AddEvent() method to add a log to our activity to signify the completion of the method.
Now, let’s call this method in our Program class:
using var activity = activitySource.StartActivity("Root trace");

var traces = new Traces(activitySource);

await traces.LongRunningTask();
To start, we’ll create a root trace using the StartActivity() method. Next, we instantiate a new Traces class, passing in our activitySource object. Finally, we call the LongRunningTask() method to generate a new activity with an event attached.
Now, let’s run our application and check the console output:
Activity.TraceId:            98480fabcd11e1d063f745de3617c8e5
Activity.SpanId:             7ab33a757f8c9b46
Activity.TraceFlags:         Recorded
Activity.ParentSpanId:       3a6d1885de42a0e4
Activity.ActivitySourceName: OpenTelemetryCollector
Activity.DisplayName:        Long running task
Activity.Kind:               Internal
Activity.StartTime:          2023-03-11T07:31:08.6174550Z
Activity.Duration:           00:00:01.0127066
Activity.Events:
    Long running task complete [11/03/2023 07:31:09 +00:00]
Resource associated with Activity:
    service.name: OpenTelemetryCollector
    service.instance.id: f7e260ca-510d-4b5d-a98d-296a533f0366

Activity.TraceId:            98480fabcd11e1d063f745de3617c8e5
Activity.SpanId:             3a6d1885de42a0e4
Activity.TraceFlags:         Recorded
Activity.ActivitySourceName: OpenTelemetryCollector
Activity.DisplayName:        Root trace
Activity.Kind:               Internal
Activity.StartTime:          2023-03-11T07:31:08.6166319Z
Activity.Duration:           00:00:01.0281051
Resource associated with Activity:
    service.name: OpenTelemetryCollector
    service.instance.id: f7e260ca-510d-4b5d-a98d-296a533f0366
Here, we see two spans that we defined previously, one of which includes the event we created.
This is a good start. But we are constrained by exporting our traces to the console. To add a new exporter, we need to stop the application, alter the configuration and start it again which is not flexible.
Export Telemetry To OpenTelemetry Collector
Now, let’s look at improving our application by exporting our logs to the OpenTelemetry Collector.
Configure Application to Export to Collector
To start, we need a new NuGet package. So let’s add the OpenTelemetry.Exporter.OpenTelemetryProtocol package.
With this package, we can configure our application to export to the Collector:
using var traceProvider = Sdk.CreateTracerProviderBuilder()
    .AddSource("OpenTelemetryCollector")
    .SetResourceBuilder(
        ResouceBuilder.CreateDefault()
            .AddService(serviceName: "OpenTelemetryCollector"))
    .AddOtlpExporter(opt =>
    {
        opt.Protocol = OtlpExportProtocol.Grpc;
        opt.Endpoint = new Uri("http://localhost:4317");
    })
    .Build();
To start, we remove our AddConsoleExporter() method, as that’s no longer required. Next, we use the AddOtlpExporter() method to configure how and where we want to see our traces to.
We have two protocols to choose from, HTTP and gRPC. gRPC is more performant as it uses binary serialization, so let’s go with that. Finally, we need to define the endpoint location of our Collector, which we’ll configure next.
Before we run our Collector using Docker, we need to create a configuration file, so let’s look at that now.
Configure OpenTelemetry Collector
Three components make up the Collector; receivers, processors, and exporters, which we covered earlier. To start, let’s create a new YAML configuration file:
receivers:
  otlp:
    protocols:
      grpc:
First and foremost, we need to define our receiver. We use the otlp receiver, which will allow us to ingest traces, metrics, and logs in the OTLP format. Also, we specify that we are going to receive this data over the grpc protocol.
Next, let’s add a basic processor to our configuration:
processors:
  batch:
The batch processor simply places our telemetry data into batches, which helps compress the data and reduce the total number of outgoing connections to our configured exporters.
The final component is our exporter:
exporters:
  logging:
    loglevel: debug
For now, we’ll simply send our trace data to the console. Here, we define a log level, which will allow us to see the traces in our console window.
We’re not done yet though. Defining our receivers, processors, and exporters is not enough. We need to define which ones are enabled in the services block:
service:
  pipelines:
    traces:
      receivers: [otlp]
      processors: [batch]
      exporters: [logging]
We break this down into three pillars; traces, metrics, and logs. As we are only working with traces today, we don’t need to define the others. Here, we configure which receivers, processors, and exporters we want to use for our trace data.
Run OpenTelemetry Collector
With our Collector configured, let’s create a docker-compose file to run our Collector:
version: '3'
services:

  otel-collector:
    container_name: otel-collector
    image: otel/opentelemetry-collector
    command: ["--config=/etc/collector-config.yaml"]
    volumes:
      - ./Configuration/collector-config.yaml:/etc/collector-config.yaml
    ports:
      - "4317:4317"
Here, we define a service, otel-collector which contains the required configuration to run our OpenTelemetry Collector. We create a volume mount so our Collector has access to our configuration file, passing it as part of the startup with the command property.
The final part to remember is to map port 4317, which is what the Collector will use to listen for our telemetry data. Also, this is the port we defined in our application.
With our docker-compose file created, let’s run our collector:
docker-compose up
Now we can run our application, and we should see our traces in the console window for the collector container:
otel-collector    | 2023-03-12T09:22:50.184Z    info    TracesExporter
                      {"kind": "exporter", "data_type": "traces", "name": "logging", "#spans": 1}
otel-collector    | 2023-03-12T09:22:50.184Z    info    ResourceSpans #0
otel-collector    | Resource SchemaURL:
otel-collector    | Resource attributes:
otel-collector    |      -> service.instance.id: Str(f7e260ca-510d-4b5d-a98d-296a533f0366)
otel-collector    |      -> service.name: Str(OpenTelemetryCollector)
otel-collector    | ScopeSpans #0
otel-collector    | ScopeSpans SchemaURL:
otel-collector    | InstrumentationScope OpenTelemetryCollector
otel-collector    | Span #0
otel-collector    |     Trace ID       : fba762c1da7d0fe92e245f6329402231
otel-collector    |     Parent ID      : 3ede038330cb130e
otel-collector    |     ID             : e348c2ec4192ea2d
otel-collector    |     Name           : Long running task
otel-collector    |     Kind           : SPAN_KIND_INTERNAL
otel-collector    |     Start time     : 2023-03-12 09:22:44.8983629 +0000 UTC
otel-collector    |     End time       : 2023-03-12 09:22:45.9027239 +0000 UTC
otel-collector    |     Status code    : STATUS_CODE_UNSET
otel-collector    |     Status message :
otel-collector    | Events:
otel-collector    | SpanEvent #0
otel-collector    |      -> Name: Long running task complete
otel-collector    |      -> Timestamp: 2023-03-12 09:22:45.9025618 +0000 UTC
otel-collector    |      -> DroppedAttributesCount: 0
otel-collector    |     {"kind": "exporter", "data_type": "traces", "name": "logging"}

// output removed for brevity
Although we see more information than the output we previously saw when we were exporting to the console directly from our application, we see the same information for our trace. We see our Long running task activity, with the event we defined.
This confirms we are sending trace data to our OpenTelemetry Collector, great!
Export to Observability Tool (Jaeger)
The real beauty of using the OpenTelemetry Collector is being able to send our telemetry data to one or multiple observability backends. So, let’s see it in action.
As we’re working with traces in our application, let’s use Jaeger to visualize our data.
We’ll start by amending our docker-compose file to add Jaeger:
version: '3'
services:

  otel-collector:
    container_name: otel-collector
    image: otel/opentelemetry-collector
    command: ["--config=/etc/otel-collector-config.yaml"]
    volumes:
      - ./Configuration/collector-config.yaml:/etc/otel-collector-config.yaml
    ports:
      - "4317:4317"

  jaeger:
    container_name: jaeger
    image: jaegertracing/all-in-one
    ports:
      - "16686:16686"
      - "14250"
Here, we add a new service for our Jaeger container, providing some configuration for port mappings. First, 16686 is the frontend UI that we will use to view our traces. The other port, 14250 is the port we use to allow Jaeger to accept the OTLP format data from our Collector.
Now, in our Collector configuration file, we add a new exporter for Jaeger:
exporters:
  logging:
    loglevel: debug
  jaeger:
    endpoint: jaeger:14250
    tls:
      insecure: true
Here, we add the jaeger exporter, defining an endpoint that Jaeger will ingest trace data on. Note we use the jaeger alias as we have both the Collector and Jaeger running in Docker. Finally, we set the tls insecure property as we are running locally. This is not recommended in production scenarios but is fine for the purposes of this article.
Finally, we need to enable our Jaeger exporter for traces:
service:
  pipelines:
    traces:
      receivers: [otlp]
      processors: [batch]
      exporters: [logging, jaeger]
We need to make sure to restart our Collector to pick up the configuration changes. With this done, we can re-run our docker-compose configuration to run both the Collector and Jaeger:
docker-compose up
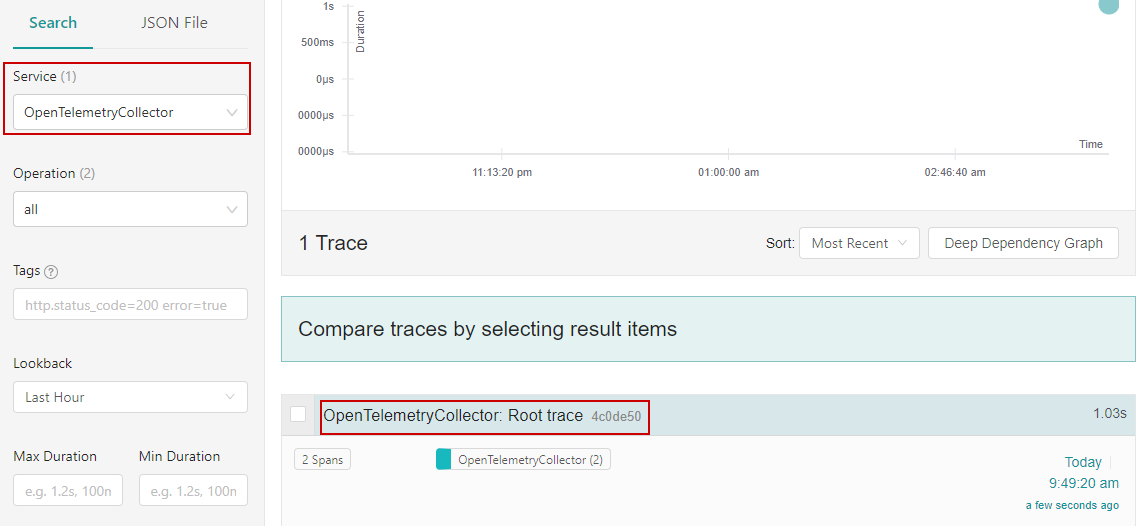
Now, let’s run our application again and navigate to http://localhost:16686 to access the Jaeger interface and see our trace:
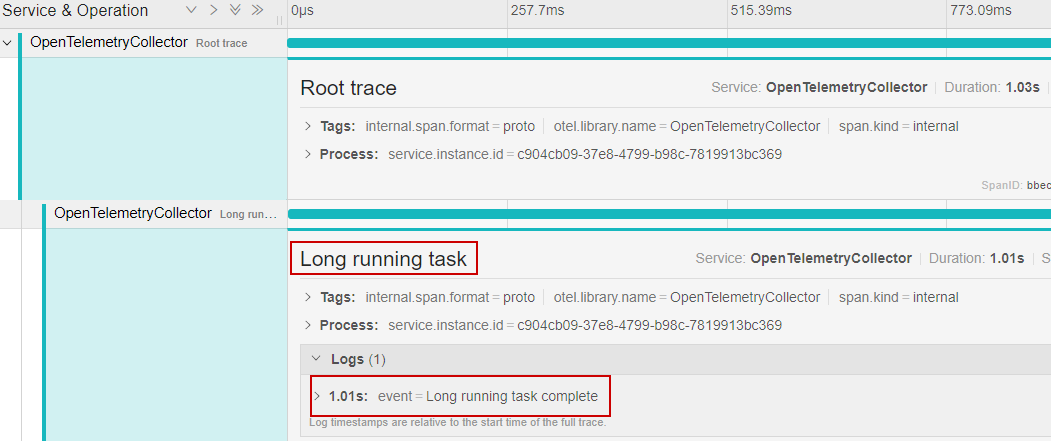
Next, by selecting our trace, we can see the custom activity and event we created:
Notice we haven’t had to touch our application code at all. Because of this, we can just as easily add another exporter and send our telemetry data to multiple backends at once.
Conclusion
The OpenTelemetry Collector is a very useful tool that avoids tight coupling between our application code and any number of observability backends. Most of these backends now support the OTLP format, meaning we can easily swap one for another, or use multiple in conjunction, without having to change our application code.
In this article, we started by understanding the components that make up the OpenTelemetry Collector. Then we saw how to export our telemetry data to the Collector, using Jaeger as an observability backend.


