

In this article, we’ll be talking about advanced debugging and inspecting data in C#. We’ll be using Visual Studio 2022 to demonstrate all the debugging techniques. For more information about general debugging, we have another article on the basics of debugging, so feel free to check it out.
Let’s start by creating a project that we’ll be using throughout the article.
Getting Ready to Start Debugging
We need a project that we can test debugging on.
Let’s keep it simple. All the code will sit inside the Program class:
var txt1 = "unbelievable";
var txt2 = "complicated";
var txt3 = "interesting";
var txt4 = "temporary";
var txt5 = "extraordinary";
var txt6 = "proportional";

List<string> txts = [txt1, txt2, txt3, txt4, txt5, txt6];

Thread thread = Thread.CurrentThread;
thread.Name = "Main";

Random rnd = new();

foreach (var txt in txts)
{
    int length = rnd.Next(3, txt.Length);
    Console.WriteLine(PrintPart(txt, length));
}

static string PrintPart(string txt, int charsCount)
{
    return txt[..charsCount];
}
As we are using top-level statements here, the PrintPart() method will be called from the Main() method. We’re setting a thread here only because we’re going to need it later in the article when we discuss the Filter condition.
In this article, we’re not going to cover the very basics of debugging. Some basic topics are covered pretty well in our Basic Tips and Tricks to Boost Productivity in Visual Studio article.
So, let’s start with conditional breakpoints.
Conditional Breakpoints
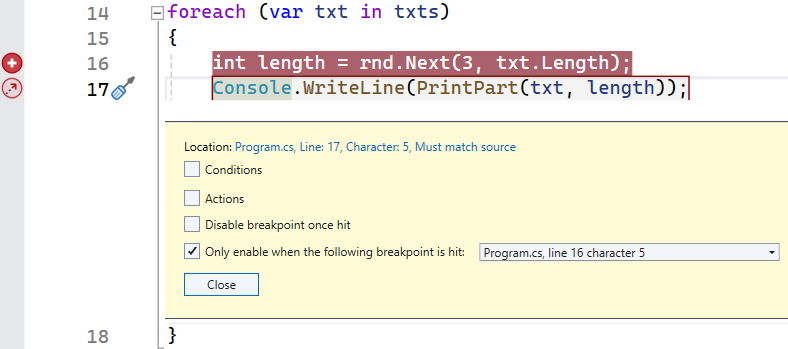
Let’s say we want the app to break only when the Length property of txt is less than 12. To do that, we have to define a condition.
If we hover over the breakpoint, a popup window shows up. There, we select Settings and check Conditions. We should have the Conditional Expression as an option in the first dropdown. In the second dropdown we can choose between Is true and When changed. The former suits our scenario better. Finally, we enter our condition:
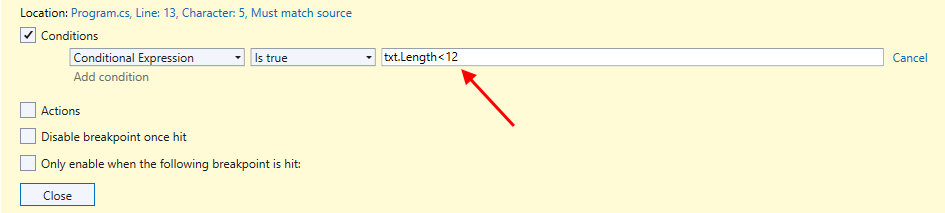
If we now hit the Close button and execute the program, it won’t break in the first iteration of the loop. This is because the txt variable at the moment has the value “unbelievable“, which is a 12-character string, so the condition is not met. It will break in the second iteration, though, when the value of txt is “complicated“. This string is less than 12 characters long, so we meet the condition.
But how do we know we hit the correct breakpoints? Here we have access to the code and we know the values of the strings in the txts list. But what if we didn’t? Fortunately, there is a way to log information to the output window. We use tracepoints to do that.
Tracepoints
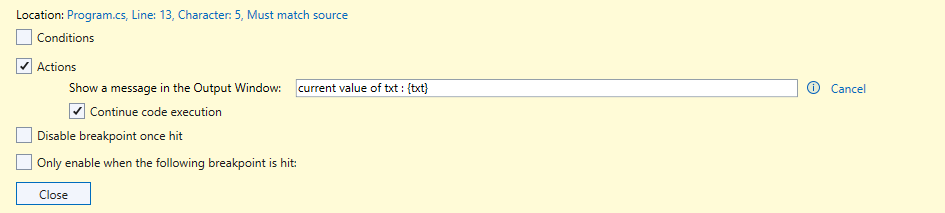
A tracepoint is a breakpoint that prints a message to the Output window. We can set it not to pause the execution of the program, and they can work with or without conditions.
Let’s remove the condition we set before. Next, let’s turn our breakpoint into a tracepoint. We can do this in Breakpoint Settings, too. This time, we check the Actions checkbox and enter the message we want to print. In the message, we don’t use quotes. We should enclose the variables whose values we want to display in curly braces. If we also check the Continue code execution option, the program will run without pausing at the breakpoints:
The breakpoint is now represented by a diamond:
![]()
This means it has been turned into the tracepoint.
If we run the program now, we’ll see the message in the Output window each time a tracepoint is hit:
current value of txt : "unbelievable"
current value of txt : "complicated"
current value of txt : "interesting"
current value of txt : "temporary"
current value of txt : "extraordinary"
current value of txt : "proportional"
We can also add a condition to the tracepoint:
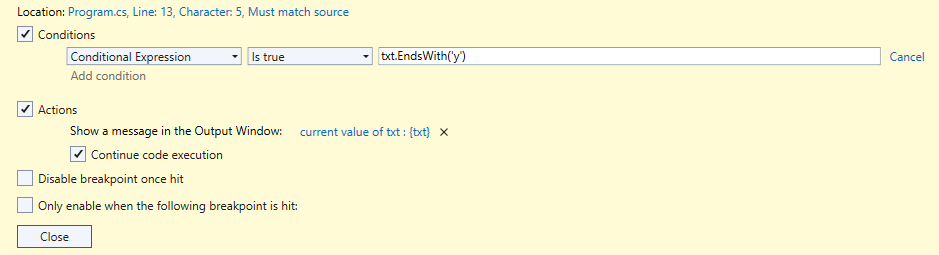
If we now run the app, we can see more easily which breakpoints we hit:
current value of txt : "temporary"
current value of txt : "extraordinary"
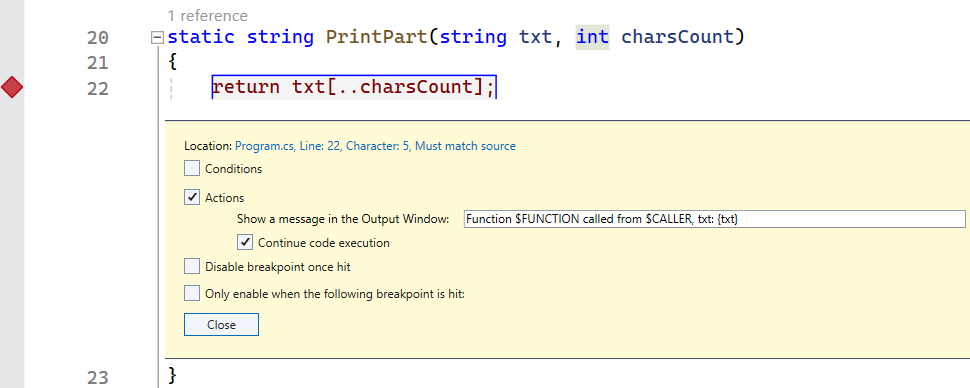
If we need more specific information, we can use special keywords inside the message. They are all capitalized and start with a dollar sign.
Let’s remove the tracepoint and set a new one inside the PrintPart() method. Now we can use the $FUNCTION and $CALLER keywords. The former displays the name of the current function. The latter displays the name of the calling function:
If we now run the app, we’ll hit the tracepoint six times:
Function Program.<Main>$.__PrintPart|0_0(string, int) called from Program.<Main>$, txt : "unbelievable"
Function Program.<Main>$.__PrintPart|0_0(string, int) called from Program.<Main>$, txt : "complicated"
Function Program.<Main>$.__PrintPart|0_0(string, int) called from Program.<Main>$, txt : "interesting"
Function Program.<Main>$.__PrintPart|0_0(string, int) called from Program.<Main>$, txt : "temporary"
Function Program.<Main>$.__PrintPart|0_0(string, int) called from Program.<Main>$, txt : "extraordinary"
Function Program.<Main>$.__PrintPart|0_0(string, int) called from Program.<Main>$, txt : "proportional"
We can see that the PrintPart() method was called by the Main() method. There are more special keywords that we can use.
Sometimes we don’t want to pause the execution of the program each time we hit a breakpoint. This is where Hit Count comes in handy.
Hit Count
It is possible for a breakpoint to pause the execution of the program only after it’s hit a specified number of times. For that to happen, we have to set the Hit Count condition.
Let’s say, we want the breakpoint in our loop to pause the program on every other execution. To do this, we have to select Hit Count from the dropdown list, the Is a multiple of condition in the second dropdown, and set the value to 2. Let’s combine it with a tracepoint to see the results better:
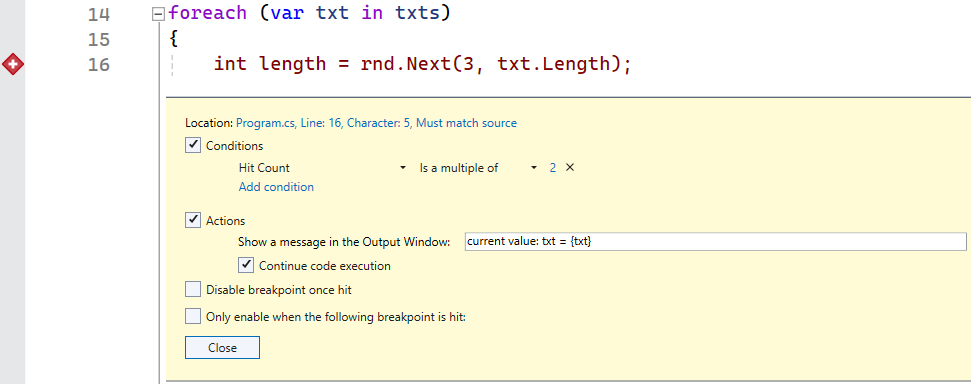
If we now run the app, we’ll see that it pauses only on every other iteration:
current value : txt = "complicated"
current value : txt = "temporary"
current value : txt = "proportional"
Besides the Is a multiple of option, we can use = and >= and combine them all together.
As we’re still on conditions, let’s discuss one more, Filter Condition.
Filter
We use the Filter condition to restrict a breakpoint to a machine, thread, or process. We will demonstrate it using the thread variable. Its Name property is set to “Main” in the code.
We can use the Filter condition to restrict the breakpoint to just this thread:
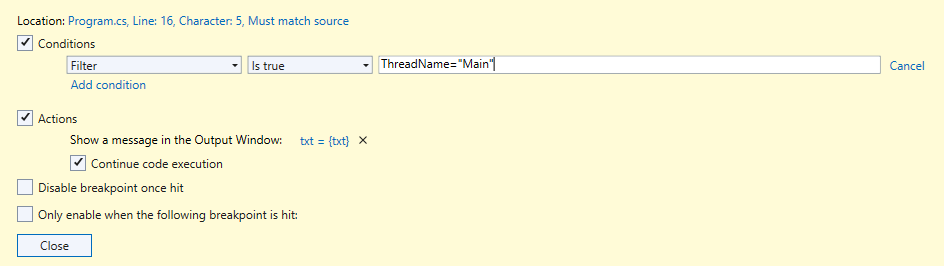
As this is the name of our only thread, all breakpoints will be hit. Naturally, this condition makes more sense if there are multiple threads. Besides, it also works for processes and machines. Other conditions we could use are ThreadId, ProcessName, ProcessId, and MachineId.
We can also combine these conditions using the & (AND), || (OR) and ! (NOT) operators along with parentheses. We just have to remember to put string values in double quotes.
Now we know how to use different conditions for our breakpoints. Let’s see how we can also change their location.
Changing Breakpoint Location
When we start executing a program, it will pause on the first breakpoint. If we want, we can change its location by modifying the line number.
Let’s move our breakpoint to line 22:
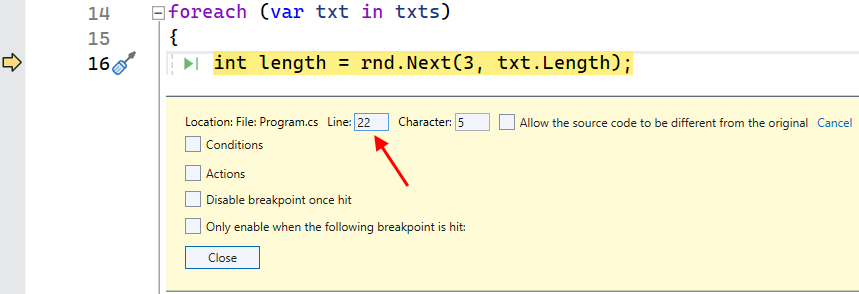
Even though we have changed the breakpoint’s location, the program is still paused at the previous location:
Naturally, we can still step through the code like before. But besides exploring the code, we can edit it while debugging. Let’s have a look at how to use this feature.
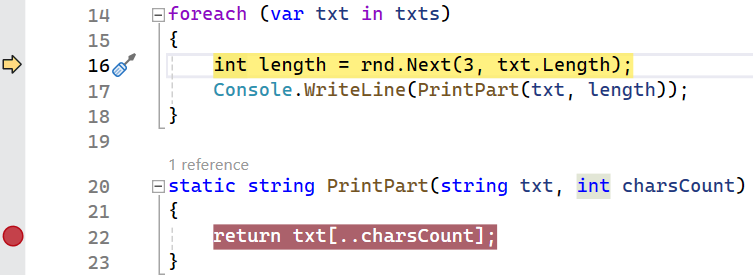
Code Editing
It is possible to edit our code in the middle of a debugging session and continue debugging.
Let’s set a breakpoint on line 16:
Now we can start debugging. When the breakpoint gets hit, we can edit the code:
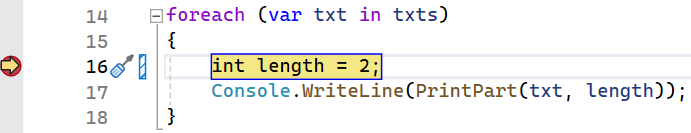
Here, we assign a fixed value to the length variable. This value is then passed to the PrintPart() function. We can now continue the debugging process. A 2-character long string appears in the console. We can edit the code each time we hit the breakpoint. For example, if we set the length variable to increasing values in each iteration of the loop, we’ll get longer and longer strings in the output:
un
com
inte
tempo
extrao
proport
Let’s not forget to set it back to its original value once we’re done experimenting. So, we know we can edit the code in a debugging session.
As a more advanced debugging technique, we can also move the execution pointer.
Execution Pointer
The execution pointer is the yellow arrow on the left. We see it during a debugging session. It indicates the line of code that will execute next. We can move it to a different line, so then that line will execute next.
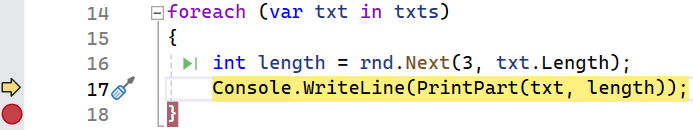
To check it out, let’s set a breakpoint on line 18 where the closing brace of the loop is. If we now run the program, it will pause on that line. In the console, we can see that a part of the first string appears:
unbe
Now we know that in this iteration of the loop, the random length of the string is 4. Suppose, we want to print it again before moving on to the next iteration. All we have to do is just drag the execution pointer to the line where we call the Console.WriteLine() method:
When we continue debugging, the code on line 17 will execute again and we’ll see the string one more time in the console:
unbe
unbe
Let’s now move the pointer to line 15 where a new random value is set. If we continue debugging now, we’ll see a portion of a different length in the output (or maybe the same if the random value is identical):
unbe
unbe
unbeliev
This way we can change the execution flow. We should be careful, though, because moving the pointer to a different position may have unexpected consequences if we don’t give it a thought.
There are also ways to determine the position to which the code should run. For example, we can use a specific function as the location.
Function Breakpoint
We can specify a function we want the debugger to run to. Here we have only one function, so let’s make the debugger run to it. We have to select New Breakpoint in the Debug menu, and then Function Breakpoint.
In the dialog window that opens, we enter the name of the function and the language:
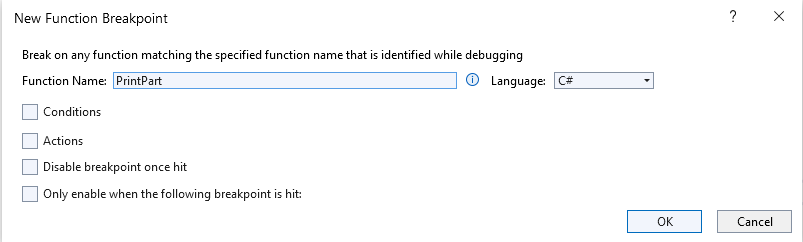
If we hit OK and run the program, it will pause at the function’s opening curly brace.
Sometimes we want to hit a breakpoint only if we have hit another breakpoint first. Let’s have a look at such dependent breakpoints next.
Dependent Breakpoints
For more advanced debugging of complex scenarios, we may want to hit a breakpoint only if we have hit another breakpoint before.
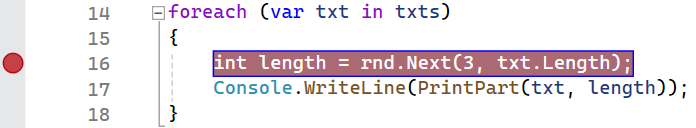
Let’s set a conditional breakpoint on line 16. It will be hit only if the txt variable starts with ‘t‘. Then, on line 17, let’s right-click on the far-left margin on that line and select Insert Dependent Breakpoint. Then let’s select the breakpoint that we want it to depend on:
If we now run the program, the second breakpoint will be hit only after the first one is hit, so when the value of txt is “temporary“.
We can also track a variable even if it goes out of scope. To do that, we use object IDs.
Object IDs
Tracking a variable even if it goes out of scope may be useful, for instance, when its value may change. To track variables during the entire debugging session, we can assign object IDs to them. It works only with reference types.
As an example, let’s track the txt variable inside the loop. The first thing we need is to set a breakpoint on a line where the txt variable already exists, like line 14. Then, in the Locals window, we have to right-click the txt variable and select Make Object ID. The ID is created and it starts with a $ symbol followed by a number so that we can tell all the IDs apart if there were more than one.
In our example, though, we only want to track one variable. All variables that reference the same object in the Locals window have the ID appended at the end:
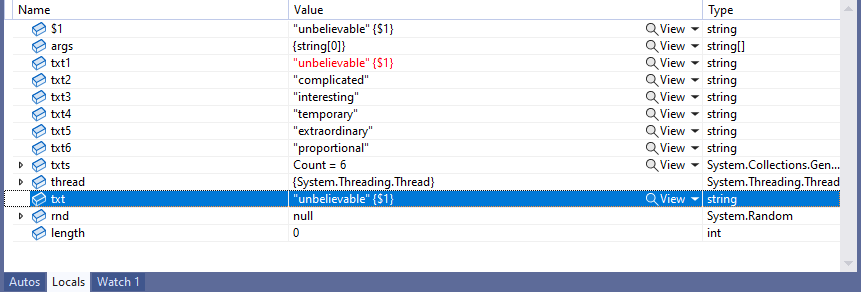
So, here variables txt and txt1 reference the same object. As we step through the code, the value of txt changes in each iteration. But we can still see the original value of the object ID:
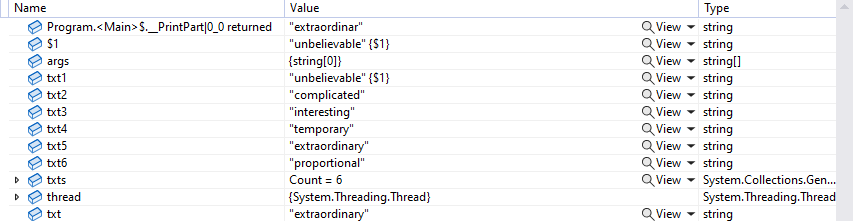
This would be the case even if we left the loop.
If we don’t need the object ID anymore, we can right-click it and select Delete Object ID.
All the debugging techniques described above are good. But if we work with complex strings, there’s one more technique worth mentioning, a string visualizer.
String Visualizer
The string visualizer is a tool that allows us to view strings. In particular, it allows us to view entire formatted strings of plain text, JSON, HTML, or XML. We don’t have such complex strings in our program to demonstrate it, but we can use the Immediate window to fix this.
Let’s set a breakpoint on line 15 and start debugging. When the execution of the program pauses, let’s change the value of txt2 in the Immediate window. We can assign a complex string to it. In our case it’s HTML, but it could be JSON or XML as well.
Now if we hover the mouse over the txt2 variable, we can see the new value (it’s also visible in the Locals window).
Let’s expand the View dropdown and select the appropriate visualizer:
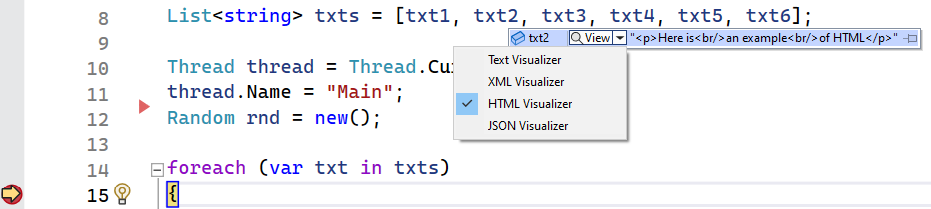
If we select the HTML Visualizer, a new window will open:
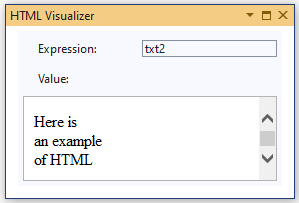
In this window, we can see the formatted string.
Conclusion
Debugging is an essential part of development. It’s not uncommon for a developer to spend more time debugging the code than writing it. That’s why it’s so important to know and use all the different tools and techniques that are available to us. If we add more advanced debugging techniques to our repertoire, our code will become cleaner and better. And we will trace problematic spots faster and more accurately.