In this article, we are going to discuss how to do ASP.NET Core Performance Testing, specifically with the open-source tool k6. We’ll cover the need for performance testing, how to get the best results, and then dive into some examples of how k6 can help.
Before we jump into k6 itself, let’s spend a moment discussing why we need to do performance testing in the first place.
Why Do We Need Performance Testing?
In the modern tech era, performance has never been a more important factor. Continual research shows that performance is one of the key factors in success. Users that need to wait for pages or apps to load will get frustrated very quickly, and move on to another competitor. The tolerance level is growing shorter and shorter as technology moves faster. Therefore, it’s critical that everything we build is performance tested to ensure our business or application has the best chance of succeeding. Put simply, the faster the app, the better it will convert (for example revenue).
Performance testing can uncover many things, to name a few:
- Bugs in our application
- Memory leaks
- Poor performance under certain conditions
- How well our system can scale
Although we do our best to write unit tests to test behavior, some things simply cannot be tested in isolation, and we need to test the entire application stack. The closer our tests are to what our users actually do, the more confidence we have in our application. Not only do these tests increase our confidence, but they also give us key insights into how we can optimize our application, future-proofing it for any forecasted growth we expect.
When Should We Do Performance Testing?
In the early days of performance testing, performance tests were generally run on a pre-prod or prod-like environment. While this is still the case, recent performance testing has significantly shifted to the left. That is, closer to the developer. The earlier we do performance tests, the closer the feedback loop and the faster we can improve on things.
So the answer to when should we do performance testing? All the time.
Good opportunities to run a performance test include:
- As we do a commit
- As we merge a pull request / major feature
- Before we do a production release
The types of tests we do at each stage will of course vary. We don’t want a 1-hour performance test running after each commit, as that will slow down our development execution time, and increase that feedback loop that we are trying to close.
We will discuss the different types of performance tests and when to do them later in the article. The key takeaway from this section is that we need to be running performance tests early and often. By treating performance as a first-class citizen of the development process, we ensure that the product we intend to release to the market is battle tested and prepared for the conditions it’s set to meet.
How to Get the Best Results From Performance Testing
Performance testing generally has two actors in a play:
- The application under test (for example website, or API)
- The machine(s) generating the load
Where these actors operate will greatly affect the results of the performance test. For example, if we are running a performance test and generating the load from our local machine, anything running on our local machine is sharing the resources with the test and therefore can impact the performance. Similarly, if we have an application running on shared resources (for example an Azure App Service sharing an App Service Plan with other Azure App Services), the performance is again impacted.
Therefore, to get the best results, we need to create a repeatable and isolated testing environment.
Some guidance we can follow
When running tests or testing an application on local:
- Keep concurrency low (< 10 concurrent users)
- Keep an eye on the CPU and Memory of your machine. If it’s too high, the test results become irrelevant
When running tests or testing an application in the cloud:
- Make sure there are no shared resources
- Make sure the conditions are repeatable. Don’t install or run additional applications between tests
In addition to creating a good test environment, the other key factor to ensuring success is setting goals.
But what does success look like?
For some: having an API performing < 500ms on average for all endpoints is enough. For other mission-critical applications, it’s < 50ms. It’s important to define these budgets up front, as they often form the basis of an SLA (Service Level Agreement) and can define when additional work needs to be undertaken as a result of performance degradation.
Now that we have discussed some basic theory behind performance testing, it’s time to get into the specifics of performance testing in ASP.NET Core, specifically testing an API with k6.
Setting up an ASP.NET Core API for Performance Testing
Performance testing can vary based on the application under the test. For the purposes of this article, we will be focusing on performance testing an ASP.NET Core API. APIs can be tested easily by hitting endpoints in isolation and measuring performance, alternatively, the endpoints can be tested as a group collection one after another (something outside the basic scope of this article).
To start off, let’s create a new ASP.NET Core API project in Visual Studio.
Next let’s remove the WeatherController, and replace it with a StringController:
using Microsoft.AspNetCore.Mvc;
using System.Text;

namespace API.Controllers;

[ApiController]
[Route("[controller]")]
public class StringController : ControllerBase
{
    [HttpGet("reverse")]
    public string Reverse([FromQuery] string input)
    {
        var reverse = new StringBuilder(input.Length);
        for (int i = input.Length - 1; i >= 0; i--)
        {
            reverse.Append(input[i]);
        }

        Thread.Sleep(500);

        return reverse.ToString();
    }
}
Here, we simply have an API that takes a string input and reverses it. We also sleep for 500 milliseconds to simulate some actual real work being done. The implementation of the API itself is irrelevant to our discussion here, we are just creating an API that does some work.
If we hit the URL https://localhost:7133/string/reverse?input=emosewa%C2%A0si%C2%A0ezamedoc in our favorite browser (note: you may need to change the port), we receive the response we expect:
codemaze is awesome
Now that we have a simple API to be used as the application under test, we can get into how to test it with k6.
What is k6?
k6 is an open-source performance testing tool from Grafana Labs, probably best known for its dashboarding and operational tools. k6 was launched in 2017 as a new way of making it simpler for developers to write and execute performance tests. Before then, the most popular load testing tool was arguably jMeter. While a perfectly acceptable tool, there is a steep learning curve and the tool itself requires a number of dependencies.
k6 on the other hand utilizes JavaScript to write tests. This introduces a number of benefits:
- Writing tests in a familiar language
- Ability to make use of a large programming ecosystem
- Tests are easy to understand
- Test scripts can be checked into source control (although this is also possible with jMeter, it’s much easier to do a diff on JavaScript files)
In addition to this, k6 is a standalone tool with no dependencies. This makes installation a breeze and makes it easy to configure on build systems.
While the tool itself is open-source and free to use, there is also the k6 cloud which offers hosted services to generate load, which is a good option for pre-prod performance testing. For the purposes of this article, however, we will focus on the open-source version and generate load from our local machine.
Running Our First K6 Test
In order to run our first k6 test, the first thing to do is set up k6 on our local machines.
Setting Up k6
There are a few ways to set up k6, that we can discover on the installation page. In our case, we’ll download the latest official MSI for Windows.
Once we have k6 installed, let’s add a new folder called scripts in our solution, and add a JavaScript file called basic-test.js:
import http from 'k6/http';
import { sleep } from 'k6';

export default function() {
    http.get('https://localhost:7133/string/reverse?input=emosewa%C2%A0si%C2%A0ezamedoc');
    sleep(1);
}
Here we import the http and sleep modules from k6, then export a default function that does an HTTP GET to our endpoint and sleeps for 1 second. The sleep is used to control the pace of our tests, and to simulate normal user behavior. This configuration means we’ll execute no more than 1 request a second, providing some constant pacing throughout our test runs.
Running the Test
Let’s now open up a console, navigate to our scripts folder, and run the k6 run command, keeping the defaults:
k6 run basic-test.js
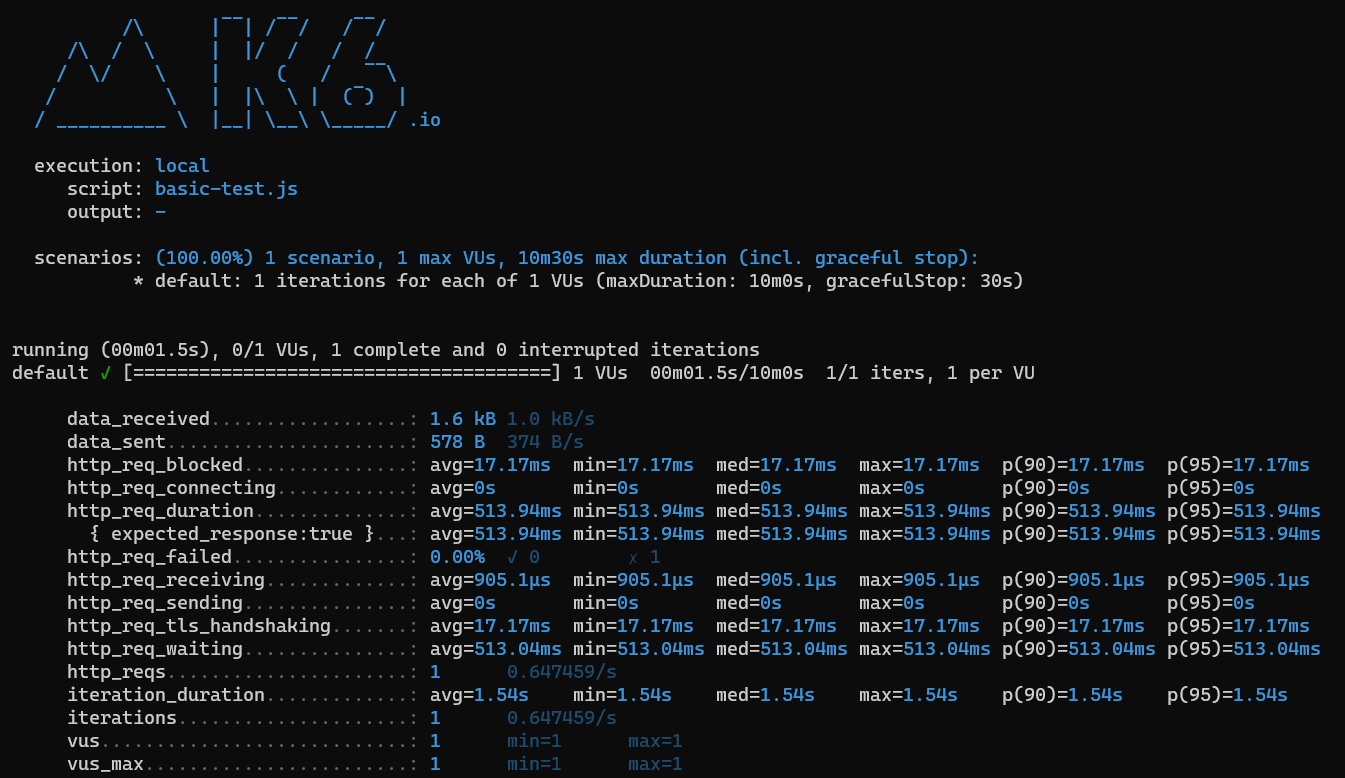
After just a couple of seconds, we see the output:
Analyzing Results
Let’s discuss a few key bits of detail:
- “1 max VUs”: this signifies we are running 1 virtual user, or 1 thread executing the load
- Most metrics include average, min, median, max, and 90th / 9th percentile performance. This gives a good spread of data as to how the API is performing
- “http_req_duration”: this is probably the most important of the metrics. It tells us the response time overall for the API
- “https_reqs”: this tells us the requests that were completed. Because are sleeping for 1 second in our test, and we are only running 1 user for 1 second, this gives us an RPS of 1. This number will change as we increase the load
The k6 console output is very useful to get a quick summary of the performance test. We can also output the results to a text file, or stream them to a data source like Grafana Cloud / Prometheus, but that is outside the scope of this article.
The Different Types of Performance Testing
There are a variety of different performance tests, and different people give them different names. However, the most common performance tests are generally regarded as:
- Smoke test
- Load test
- Stress test
- Spike test
- Soak test
As each has different characteristics and goals, let’s dedicate some time to each.
Smoke Test
A Smoke test is the simplest type of performance test. It tests our application under minimal load, for a very short period of time. Its goals are to identify any apparent bugs or regressions. Because of these characteristics, it makes a great candidate to run on every commit or pull request, as we get fast feedback whilst not slowing our development process down too much.
k6 uses JavaScript, which means we can make use of the features of the framework. Because we are going to be calling the same API throughout our tests, it’s worth now creating a config.js file:
const API_BASE_URL = 'https://localhost:7133/';
const API_REVERSE_URL = API_BASE_URL + 'string/reverse?input=codemaze%20is%20awesome';

export { API_REVERSE_URL };
Now we can add a new script called smoke-test.js, and import our config:
import http from 'k6/http';
import { sleep } from 'k6';
import * as config from './config.js';

export const options = {
    vus: 1,
    duration: '1m',

    thresholds: {
        http_req_duration: ['p(95)<1000']
    },
};

export default function () {
    http.get(config.API_REVERSE_URL);
    sleep(1);
}
This is very similar to our previous test. The key difference is the options constant. This lets us set up the k6 configuration cleanly and concisely. In this case, we are setting the vus to 1 (default), running for 1 minute, and we are also defining a single threshold. Thresholds in k6 allow us to specify some metrics that indicate a successful or failed performance test. In this case, we are telling k6 that we want at least 95% of requests to respond in < 1 second.
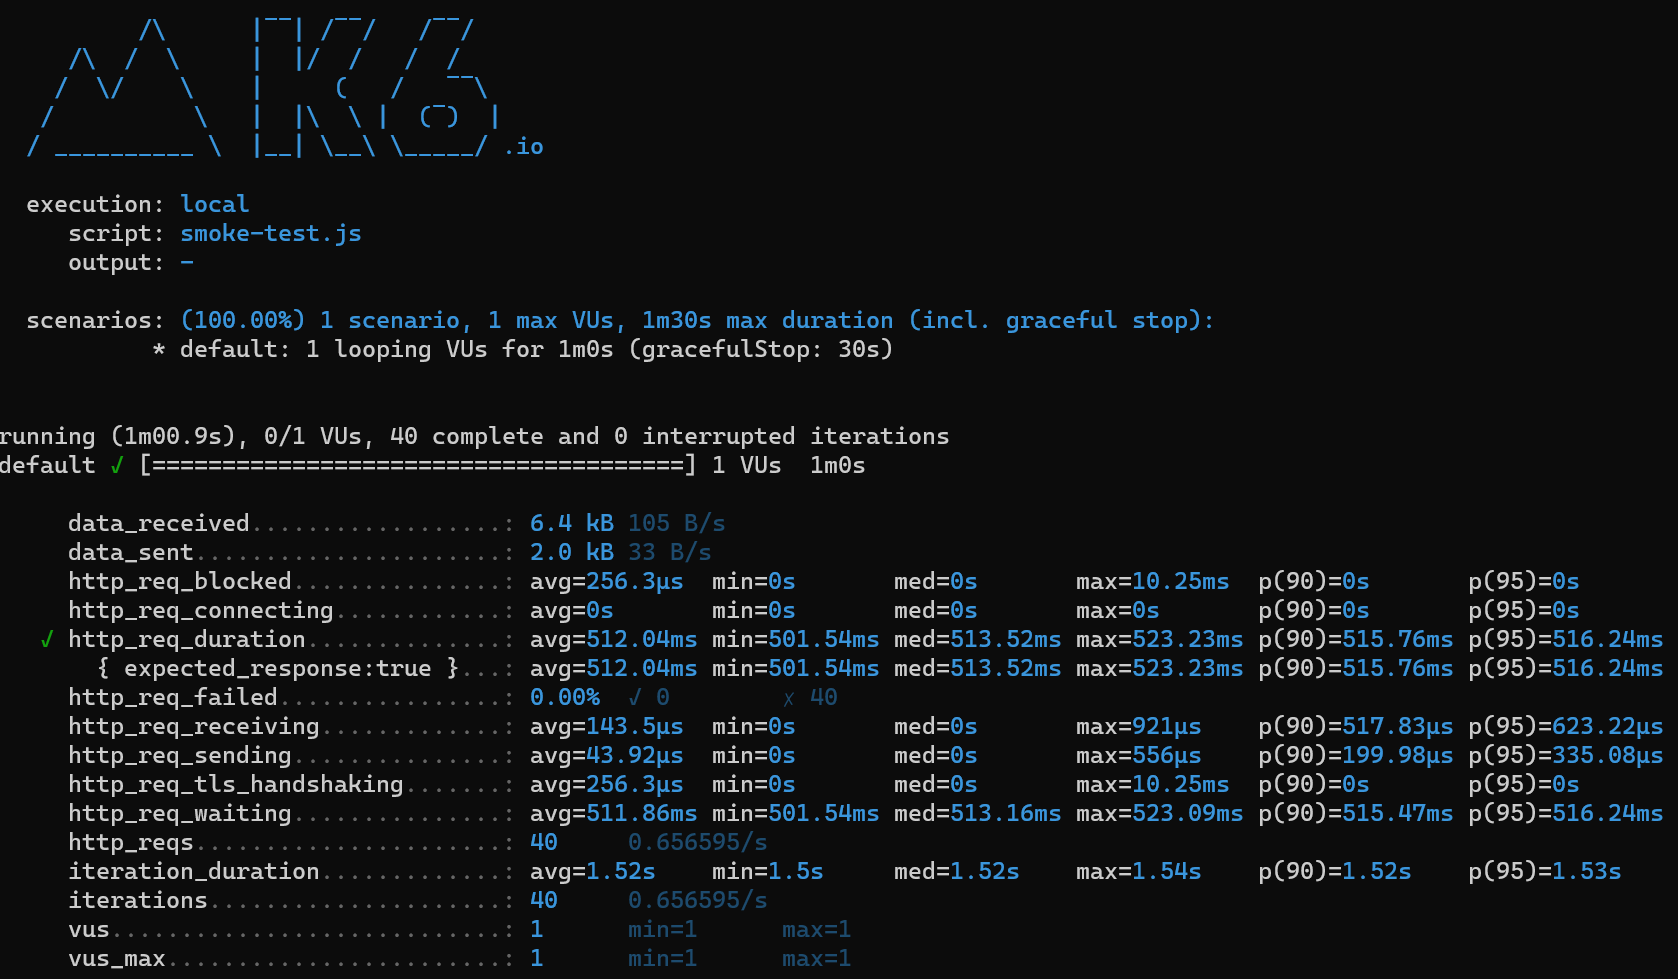
Let’s use the k6 run command again, this time passing smoke-test.js, and analyse the results:
Very similar results to previous in terms of the http_req_duration and http_reqs. We see a green tick next to the former, because our threshold succeeded, with the 95th percentile sitting at 516.24ms.
Load Test
A Load Test assesses our system performance under normal and peak conditions, the latter sometimes referred to as “Capacity Testing”. We mentioned that one of the keys to get the best results from performance testing is to know your goals, and this is critical for load testing. We might have 500 average users during the week, then 2000 average users on the weekend.
For simplicity’s sake, let’s define our “normal” load as 5 users, and “peak” as 20.
To do that, we are going to create load-test.js:
import http from 'k6/http';
import { sleep } from 'k6';
import * as config from './config.js';

export const options = {
    stages: [
        { duration: '5s', target: 5 },
        { duration: '30s', target: 5 },
        { duration: '5s', target: 20 },
        { duration: '30s', target: 20 },
        { duration: '5s', target: 5 },
        { duration: '30s', target: 5 },
        { duration: '5s', target: 0 },
    ],
    thresholds: {
        http_req_duration: ['p(95)<600'],
    },
};

export default () => {
    http.get(config.API_REVERSE_URL);
    sleep(1);
};
This test introduces a new k6 concept called “stages”. Put simply, these are the stages in our test, to simulate traffic increasing and decreasing over time.
Let’s step through each stage:
- Ramp up to 5 users over 5 seconds
- Stay at 5 users for 30 seconds (“normal” load)
- Ramp up to 20 users over 5 seconds
- Stay at 20 users for 30 seconds (“peak” load)
- Ramp down to 5 users over 5 seconds
- Stay at 5 users for 30 seconds
- Ramp down to 0 users over 5 seconds
These ramp-up/down times are not realistic. In reality, we would want each stage to last at least a minute, with the target overall runtime more in the order of 30 minutes or an hour.
It’s important to have a ramp-up stage to ensure the system has time to warm up to traffic, and it’s equally important to have a ramp-down stage to ensure the system has time to clean up effectively.
We are also being more aggressive with our http_req_duration thresholds, now that we know some baseline performance of our endpoint.
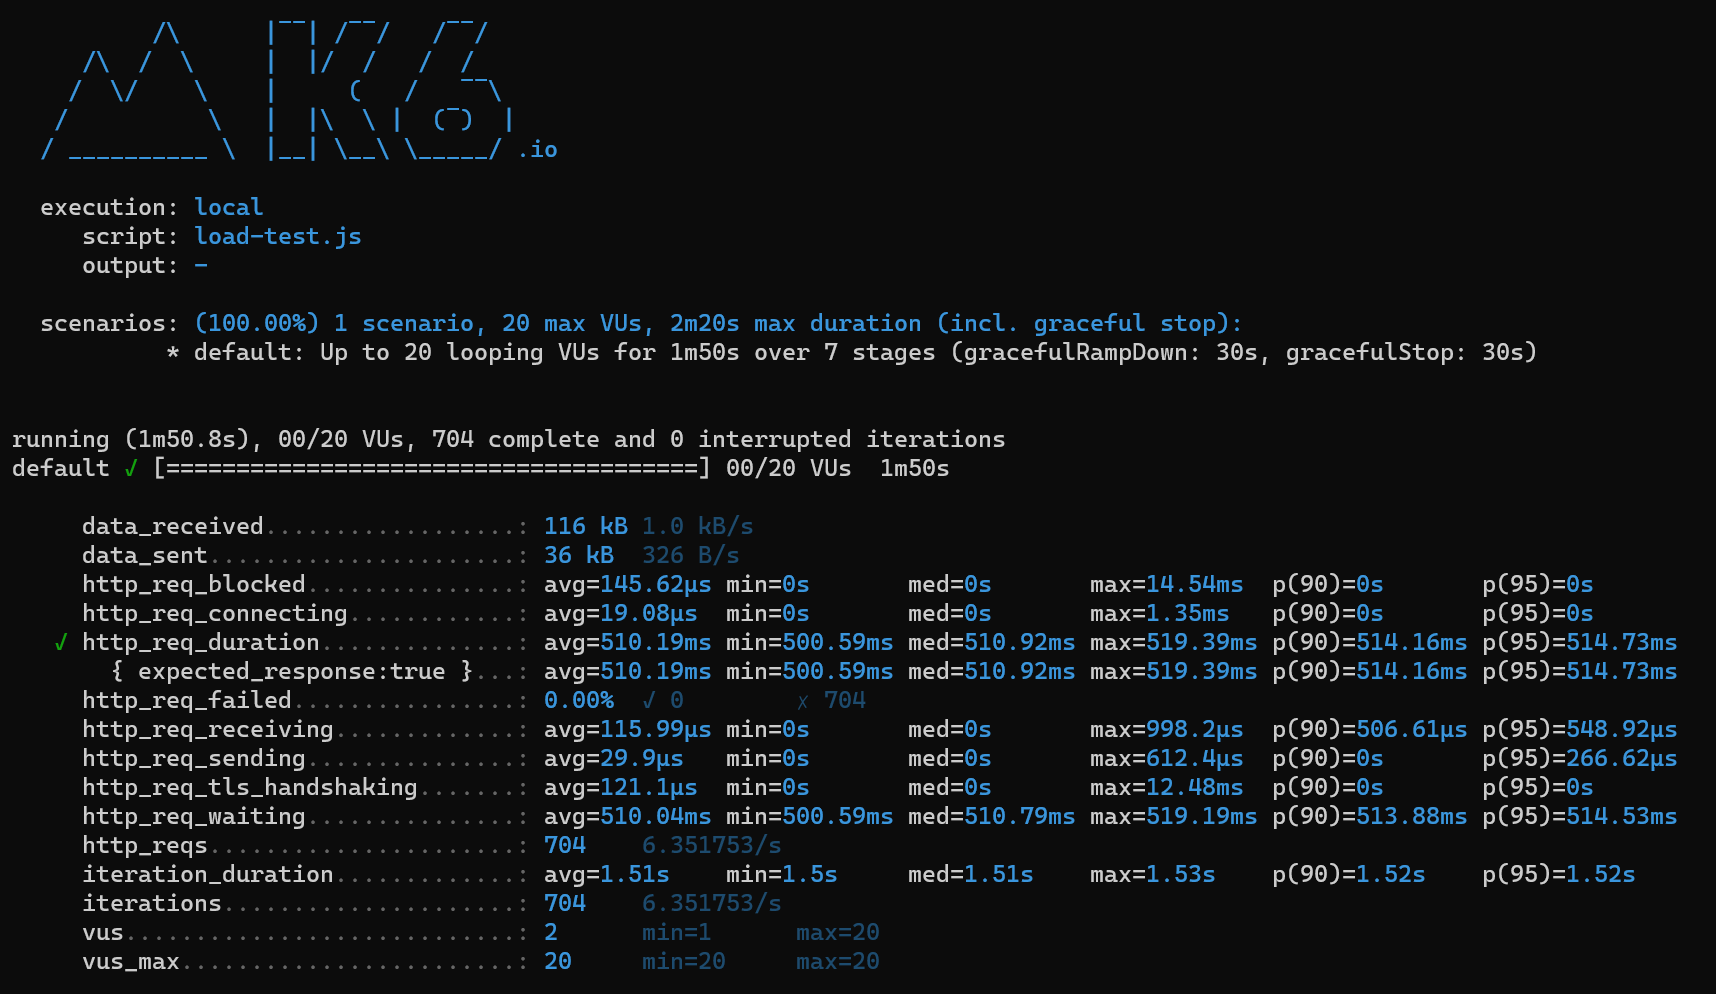
Let’s check the results:
Our threshold still passed, and our durations didn’t change too much.
So far, our API is performing well! So let’s put it under some pressure in the next test.
Stress Test
Our previous load test is concerned with testing the system under normal load. Stress testing, on the other hand, is concerned with putting the system under extreme pressure, to understand its choke point. These insights can inform decisions like how many servers are needed, how much RAM/CPU is needed, etc. A great example of a stress test, back to our eCommerce example is a “1-hour sale” promotion. During this time, we expect much more load than normal.
Knowing the limits of the system is a bit of trial and error. We can generally start with doubling our normal load conditions, and go from there.
Let’s create a stress-test.jsfile:
import http from 'k6/http';
import { sleep } from 'k6';
import * as config from './config.js';

export const options = {
    stages: [
        { duration: '5s', target: 5 },
        { duration: '30s', target: 5 },
        { duration: '5s', target: 20 },
        { duration: '30s', target: 20 },
        { duration: '5s', target: 100 },
        { duration: '30s', target: 100 },
        { duration: '5s', target: 200 },
        { duration: '30s', target: 200 },
        { duration: '5s', target: 0 },
    ],
    thresholds: {
        http_req_duration: ['p(95)<600'],
    },
};

export default () => {
    http.get(config.API_REVERSE_URL);
    sleep(1);
};
The setup is very similar to the previous one, but instead of staying at our peak of 20 users, we ramp up to 100 users (5x traffic), then 200 users (10x traffic).
As we mentioned before, the performance of the machine generating and taking load can affect results, so in this case, let’s pop open Task Manager and keep an eye on our machine’s CPU.
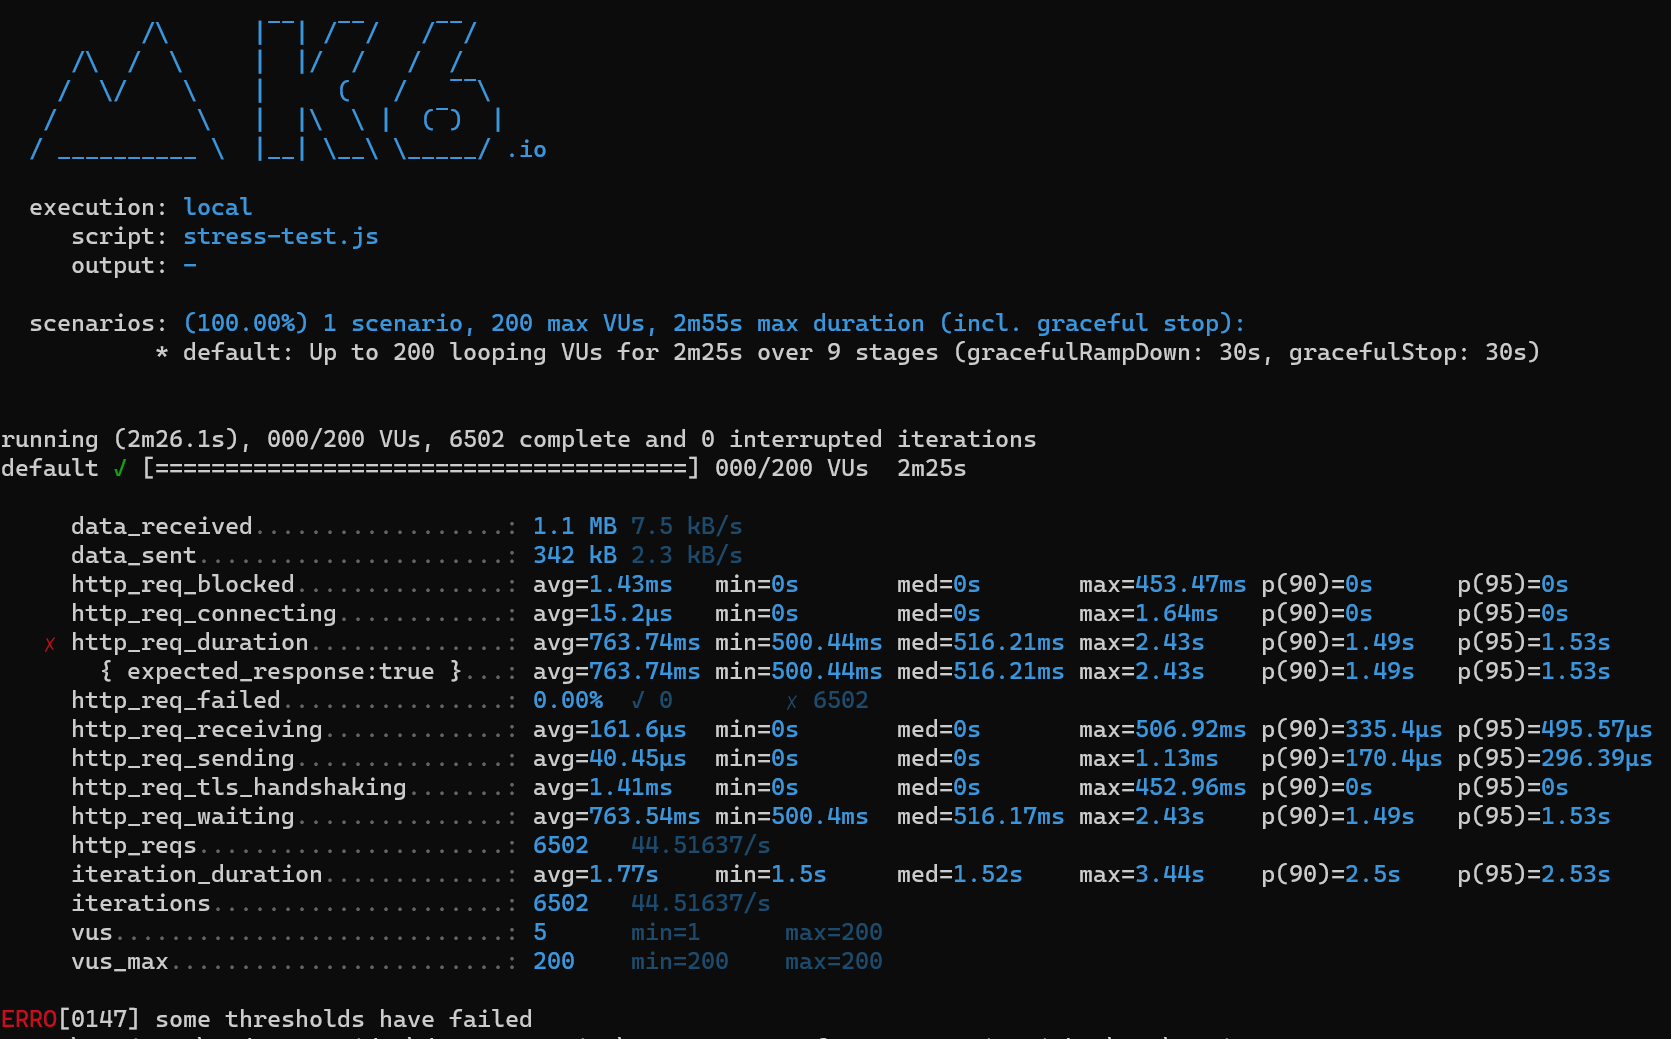
Now, let’s run and check the results:
We have some interesting results now. First off, our threshold check has now failed. This is because the 95th percentile is sitting at 1.53s, well over our target of 600ms. Let’s point out again that these types of tests ideally shouldn’t run on local environments, due to the other things running on the machine that can impact. We should generate load from a separate machine with a fixed workload, and hit our API on a physical server. But for demonstration purposes, these results still show there is a performance problem.
Spike Test
Another variation of a stress test is called a “spike test”. Similar to the stress test, its purpose is to put the system under extreme pressure. Unlike the stress test however which ramps up traffic slowly, the spike test adds an excessive amount of load immediately. This could happen if there was a sudden surge in traffic as a result of a marketing campaign, or maybe some scrapers decide they want to steal content from our API.
Let’s set up a spike test called spike-test.js:
import http from 'k6/http';
import { sleep } from 'k6';
import * as config from './config.js';

export const options = {
    stages: [
        { duration: '5s', target: 200 },
        { duration: '1m', target: 200 },
        { duration: '5s', target: 0 },
    ],
    thresholds: {
        http_req_duration: ['p(95)<600'],
    },
};

export default () => {
    http.get(config.API_REVERSE_URL);
    sleep(1);
};
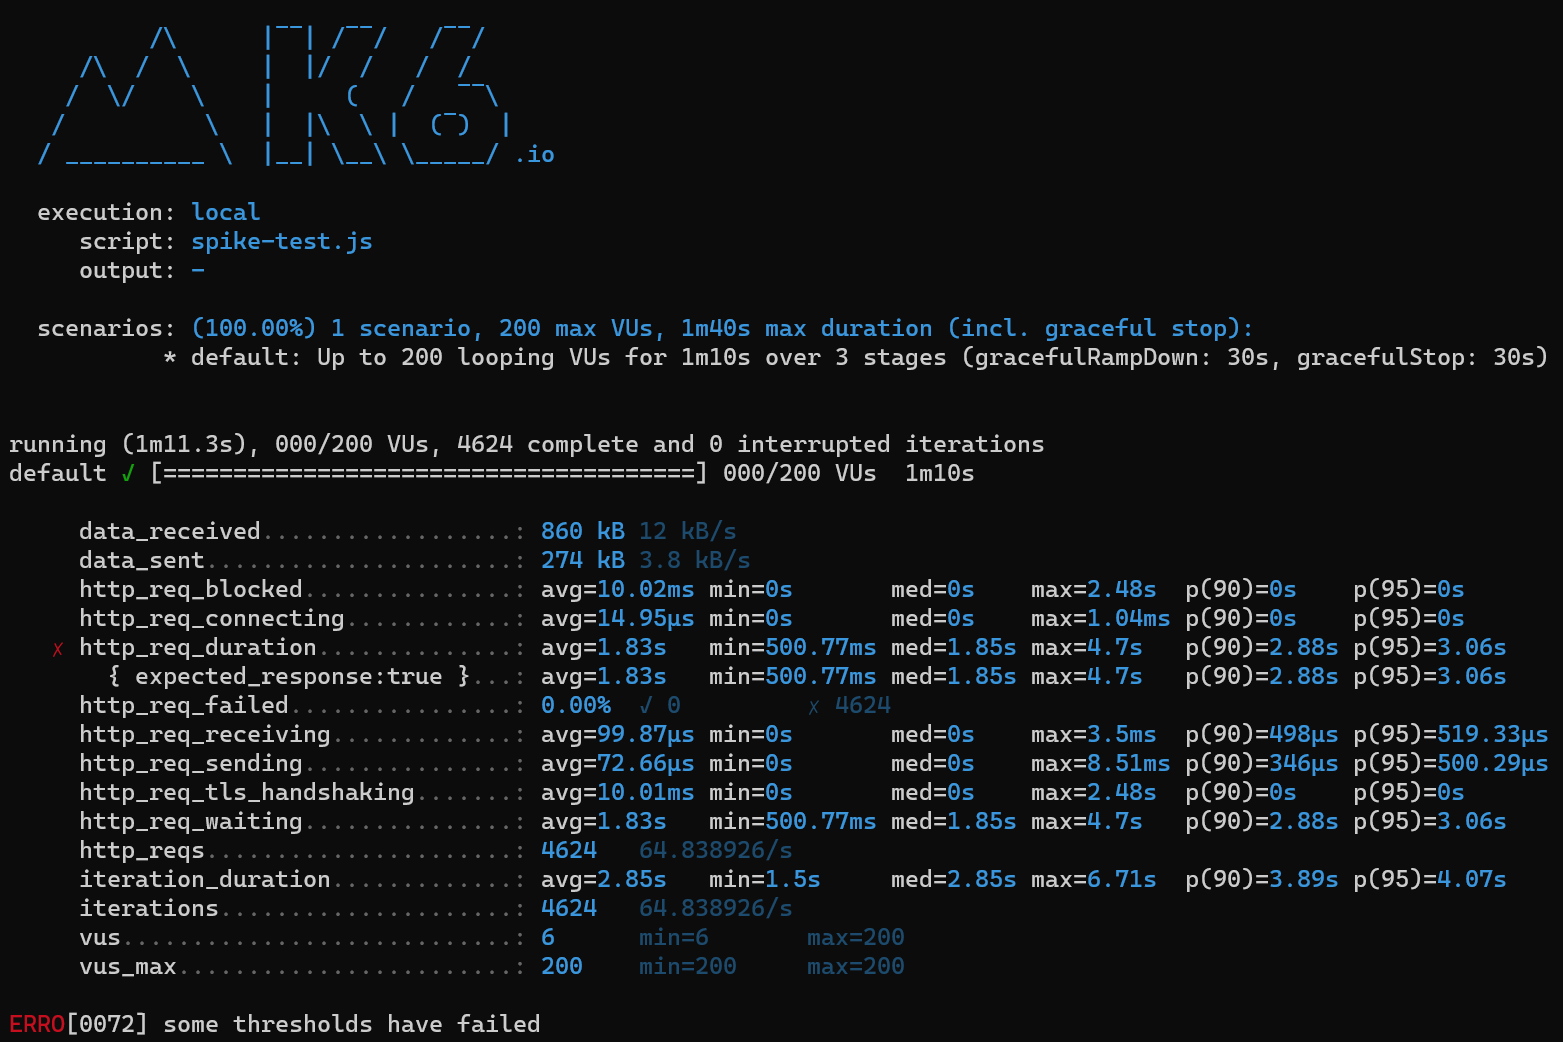
Let’s check the results:
As expected, once again our thresholds have failed. The 95th percentile is now at 3.06s, well over our 600ms benchmark, and much worse than the stress test which performed at 1.53s. This shows our API doesn’t perform well under extreme conditions.
Soak Test
The final type of performance test to discuss is called a “soak test”. This test is concerned with testing our application over an extended period of time, perhaps hours. The purpose of this test is to uncover things like memory leaks, infrastructure issues, or strange bugs relating to the state over a long period of time.
Let’s add a test called soak-test.js:
import http from 'k6/http';
import { sleep } from 'k6';
import * as config from './config.js';

export const options = {
    stages: [
        { duration: '10m', target: 16},
        { duration: '1h', target: 16 },
        { duration: '5m', target: 5 },
        { duration: '1m', target: 0 },
    ],
    thresholds: {
        http_req_duration: ['p(95)<600'],
    },
};

export default () => {
    http.get(config.API_REVERSE_URL);
    sleep(1);
};
This time we are ramping up to 16 users (80% of our peak load) over a 10-minute period, staying there for an hour, ramping back down to 5 users over 5 minutes, then down to 0 over 1 minute. We won’t run this test here due to the time it would take, but the idea is to run this test for a long duration, and keep an eye on the performance of the application (particularly memory + CPU), to identify any possible issues. Because of the length of this test, it’s suited to run in a pre-prod environment, perhaps overnight.
What Insights Have We Gained From Performance Testing?
Now that we’ve learned about the different types of performance testing, what knowledge have we gained? We saw from most of our tests (particularly the stress and spike tests), that our system in its current state cannot handle a large amount of load. As we alluded to earlier in the article, running these types of tests on a local machine isn’t ideal, and we may receive slightly different results in a more stable environment. However, the insights we receive remain the same.
To support this amount of traffic, we need to do some optimizations such as scaling up/out the server, adding a cache, or optimizing the code itself. All of these exercises are outside the scope of this article. Still, the important thing to note is that k6 and performance testing our API has given us the data to help drive these decisions, something unit or integration tests simply cannot do.
Conclusion
In this article, we have learned about the different types of performance tests and how easy it is to run them in k6 due to the native JavaScript language. k6 offers us a convenient and familiar framework that actually makes it fun to write performance tests. Because k6 is free of dependencies, it’s a good idea to include it in our build systems as a quality gate, alongside other checks like unit tests.


