

In this article, we will learn how to load test an ASP.NET Core Web API with JMeter.
So let’s get going.
Introduction to JMeter
Load testing is crucial for ensuring that web applications perform well under heavy traffic. JMeter is a popular and robust open-source tool for measuring the performance and functionality of web applications. When testing ASP.NET Core Web APIs, JMeter can simulate multiple users hitting the API endpoints simultaneously. This helps us identify potential bottlenecks and optimize the performance of our applications.
Install and Set Up JMeter
To install JMeter, download the latest stable release from the official Apache JMeter website. Once downloaded, extract the zip file to a preferred location on the system. This will be the JMeter installation directory. No additional installation steps are required, as JMeter is a Java-based application and just needs a compatible Java Runtime Environment (JRE) to run. Before launching JMeter, ensure that Java is installed on the system.
To start JMeter, navigate to the bin folder within the JMeter installation directory and execute the jmeter.bat file. This will launch the JMeter user interface:
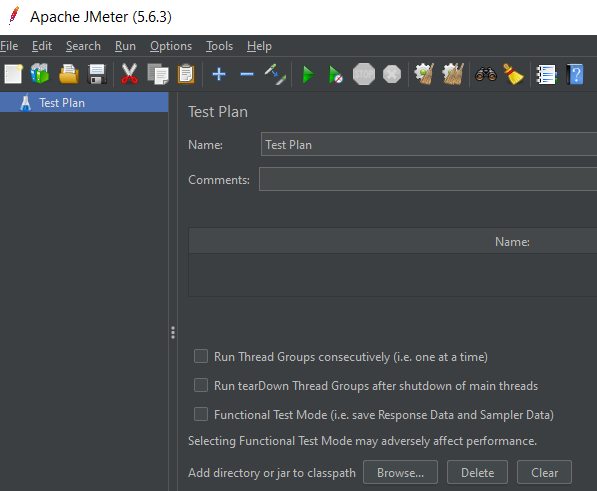
We can see that JMeter created a new Test Plan for us upon opening. Now we can add more elements to it and prepare our test plan.
Configure JMeter for Load Testing the API
Now let’s set up JMeter for testing an ASP.NET Core Web API with two endpoints (full API source code is available in GitHub). Let’s start by preparing the test plan.
Open JMeter and right-click on the Test Plan, then click Add, then Threads (Users), and choose Thread Group. Here, we can add a group of virtual users for our test:
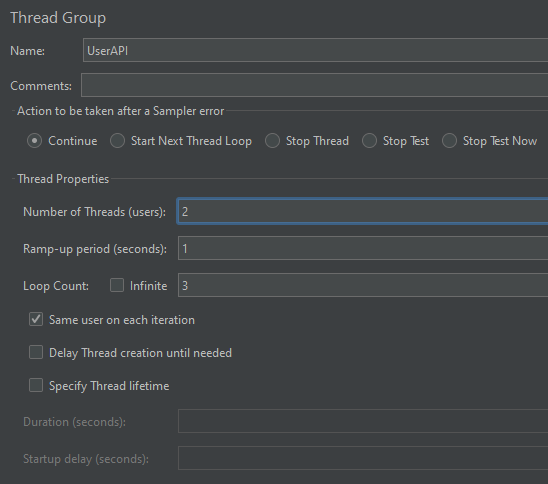
Inside the Thread Group section, we can specify how many users we want to test within the Number of Threads (users) field. Also, we can specify how quickly we want threads to start in the Ramp-up period (seconds) field. Additionally, if we want the test to run multiple times, we can specify the Loop Count.
Here we can think of each thread as one person using our API. We’re effectively telling JMeter how many people to pretend to be and how to spread out their usage.
Configure HTTP Request Samplers
Next, let’s configure HTTP Request samplers to target the specific endpoints of our ASP.NET Core Web API. Right-click on the thread group we just created and select Add, then Sampler, and then choose HTTP Request.
Here we specify the endpoints for JMeter to test. Let’s start by creating the HTTP Request for Get Users:
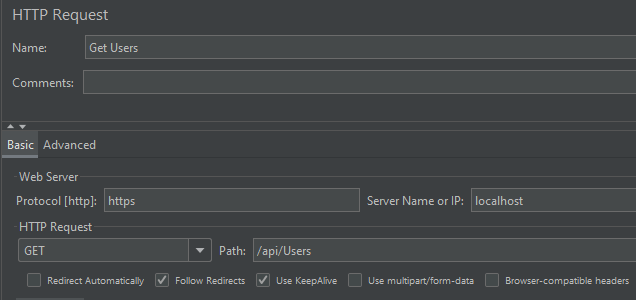
Here we’ve provided a Name for the HTTP request, as well as the Web Server details for our ASP.NET Core Web API, such as Protocol, Server Name, and Port Number. After that, in the HTTP Request section, let’s specify the HTTP Method as GET and the path as /api/Users.
Similarly, let’s provide the details for the Create User HTTP request as well:
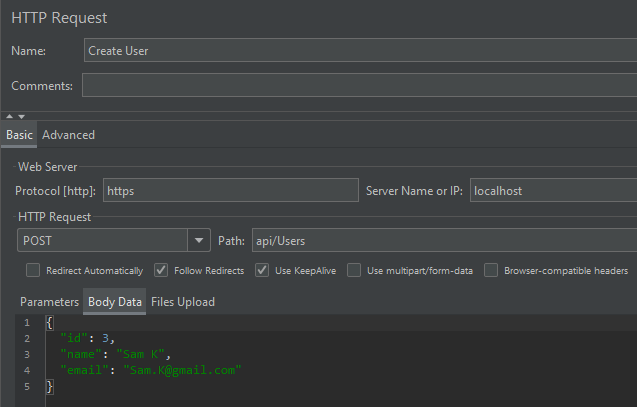
Here we just need to change the HTTP method to POST and provide the Body Data. We can specify the remaining settings as we previously set for the GET method.
Additionally, we need to configure the Content-Type header in JMeter to support JSON data format. For this, we can right-click on the Create User HTTP Request sampler and then click on Add, then Config Element and choose HTTP Header Manager:
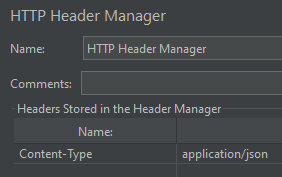
Here we’ve added a new header with the name Content-Type and the value application/json, which configures JMeter to send data in JSON format.
Configure Listeners
In JMeter, listeners are tools that help us review and analyze the results of our tests. So let’s add a few of the common listeners into our thread group so that we can view the test results. For that, we can right-click on the UserAPI Thread Group in our Test Plan, select Add, then Listener, and add the corresponding listeners one by one. Let’s add the View Results Tree listener, View Results in Table listener, and the Summary Report listener.
With this, our test plan is ready with HTTP requests and listeners:
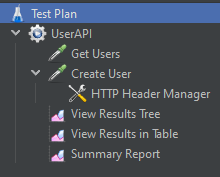
It is a good idea to save the test plan by clicking on the save button. JMeter will save the test plan as a .jmx file, which we can later reload and use again.
Run the Tests and Analyze the Results
We can run a load test by clicking the Run menu and then either selecting Start or clicking the green Start button on the toolbar.
Please note that it is not recommended to use GUI mode for load testing with a lot of threads as it will consume heavy resources. For large tests, use GUI mode only for creating and debugging tests. For running the tests, it is recommended to use the JMeter CLI command in non-GUI mode:
jmeter -n -t [path to .jmx file] -l [path to the .jtl results file]
Here, the -n option runs JMeter in non-GUI mode. We specify the path to our JMeter test plan (.jmx file) by specifying the -t option
while -l specifies the path and filename where we want to save the test results (.jtl file).
Once the test is complete, we can use the listeners to analyze the results of our two API endpoints.
View Results Tree
The View Results Tree listener provides a detailed view of each request and response during our test:
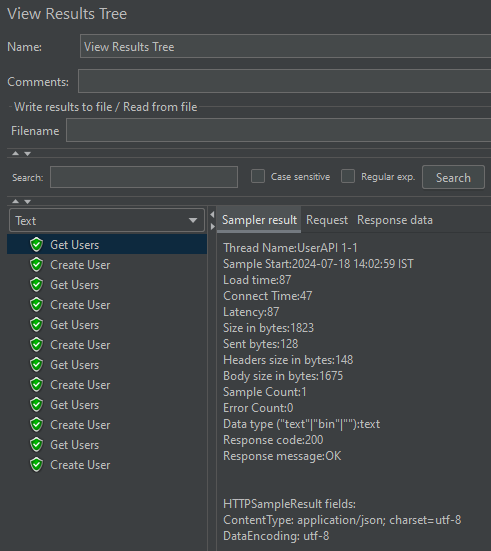
It shows the request data sent to the server, the response data received, headers, and any errors that occurred. This listener is particularly useful for debugging as we can see exactly what’s happening with each request. However, it’s not recommended to use it during large load tests as it consumes a lot of memory and can affect JMeter’s performance.
View Results in Table
The View Results in Table listener displays the results of the tests in a tabular format:
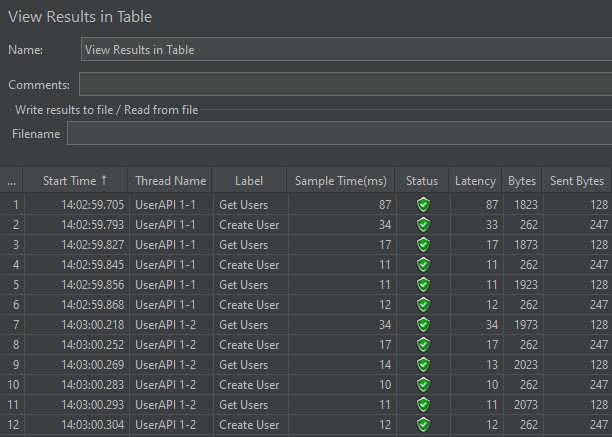
It provides a concise overview of key metrics such as sample time, latency, bytes used, status, etc. This listener is useful for quickly identifying requests that are taking longer than expected or failing, as we can easily sort the table by any column. It’s more lightweight than the View Results Tree and is better suited for larger tests.
The Summary Report
The Summary Report listener aggregates the results of the tests and provides a summary of performance metrics:
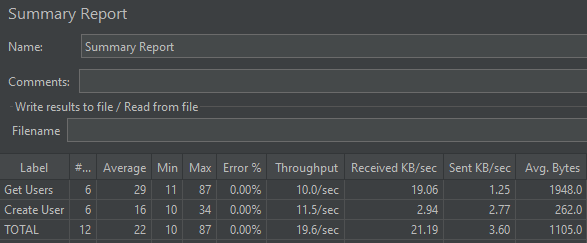
It includes information like the number of requests sent, the average response time, the min and max response times, error rate, and throughput. This is very useful for getting a quick understanding of the overall performance of the API. It helps us determine if the API meets the performance criteria and if there are any significant issues that we need to address.
In summary, each of these listeners serves a different purpose. The View Results Tree is great for in-depth analysis of individual requests and responses. The View Results in Table is ideal for a quick scan of request performance. The Summary Report gives us an overall picture of the test’s success and the API’s performance. By using these listeners, we can get a comprehensive understanding of how our API behaves under various load conditions.
Generate HTML Report from JMeter
It is possible to generate an HTML report from the JMeter test results so that we can visualize the results better. For that, we need to run our tests in non-GUI mode and then use the JMeter CLI utility to generate the report from the resulting data file.
First, let’s open a command prompt or terminal window and navigate to the bin directory of our JMeter installation. After that, let’s execute the following command to run our test plan in non-GUI mode and save the results to a .jtl file:
jmeter -n -t [path to testplan.jmx] -l [path to resultsfile.jtl]
JTL (JMeter Test Log) is the default output format for saving the results of a test run in JMeter. By default, JTL files are saved in CSV format for performance reasons. However, XML format is supported as well.
Once JMeter generates the results in a .jtl file, we can use it to generate the HTML report using the following command:
jmeter -g [path to resultsfile.jtl] -o [path to output folder]
Here -g specifies the path to the .jtl results file and -o specifies the path to the output folder where we want to generate the HTML report. Note that JMeter will create the specified folder if it does not exist. That said, ensure that the output folder does not contain any previous report data. JMeter will not overwrite an existing folder and will throw an error if the folder is not empty.
Analyze the JMeter HTML Report
Once we generate the HTML report, we can view it by opening the index.html file located in the output folder:
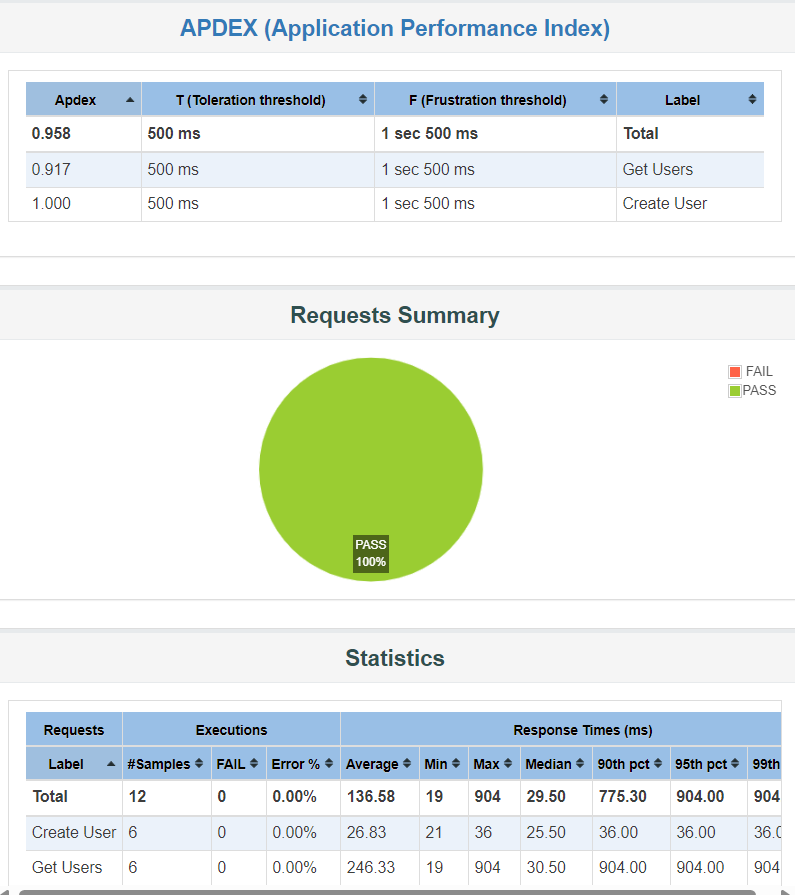
The JMeter HTML report presents a detailed visual representation of performance test results, categorized into three main sections – Dashboard, Charts, and Custom Graphs.
The Dashboard section provides a quick overview of key performance indicators. The APDEX (Application Performance Index) section measures the performance of the application. Requests Summary lists all HTTP requests and their performance metrics. Apart from that, it shows comprehensive Statistics with average, median, and percentile response times, as well as throughput and error percentages. Also, it highlights Errors, detailing the nature and frequency of test errors, and the Top 5 Errors by Sampler, pinpointing the most problematic areas.
The Charts section offers dynamic graphs that depict metrics Over Time, showcasing trends and patterns, Throughput over the test duration, and Response Times, giving insights into system behavior under load.
Custom graphs are user-defined visualizations that allow us to focus on specific metrics or data points that are not covered by the default set of graphs. To customize these graphs, we can edit the user.properties file or pass additional properties via the command line to include the desired samplers, data series, and chart types, tailoring the report to meet the specific needs of our performance testing.
Additional JMeter Configurations
Now let’s look at a couple of additional useful JMeter configurations that help us to better test our API endpoints.
Assertions
In JMeter, we can add Assertions to validate the response of an API request against expected outcomes. We can add Assertions to our HTTP requests to check various aspects of the response, such as status codes, response text, or response time. For instance, let’s see how to add a Response Assertion for the Get Users API endpoint.
First, right-click on the Get Users HTTP Request. Then click on Add, then Assertions, and choose Response Assertion.
After that, let’s configure the Assertion with the following settings:
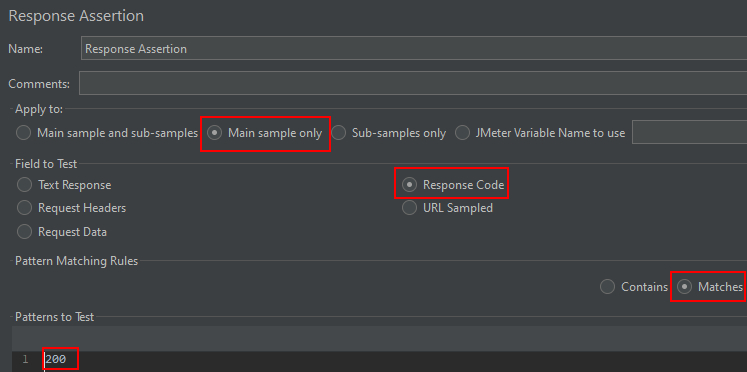
Choose the Main sample only option for Apply to, and the Response Code option for Response Field to Test. For the Pattern Matching Rules, let’s select Matches, and for the Patterns to Test, let’s provide 200. This will ensure that the response code of the HTTP request is 200.
Similarly, we can add a JSON Assertion if we want to assert the expected JSON response. Also, there is an option to add a Duration Assertion if we want to ensure the API responds within a certain time.
By adding these assertions to HTTP requests in JMeter, we can automatically validate that the APIs are returning the expected results within the acceptable response time. If the response does not meet the criteria specified in the assertions, JMeter will mark the request as failed in the test results.
Timers
JMeter has a handy tool called Timers that helps manage how fast requests are sent out, making our test behave even more like real users. Real people take breaks between actions, and timers let us mimic that by adding pauses. These pauses happen before each action that we set up in our test.
For instance, in the real world, the users of our application may first access the user list and then wait for a few seconds before creating a new user. It is possible to simulate this behavior in JMeter by creating a test plan with timers. Let’s see how to add a Constant Timer to introduce a fixed delay between requests.
First, let’s right-click on the UsersAPI Thread Group, then click Add, then Timer, and finally choose Constant Timer. In the Constant Timer settings, set the Thread Delay to 5000 milliseconds:
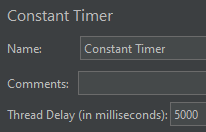
This will add a 5-second pause after each request in the group.
With this setup, each thread will access the Get Users endpoint, wait for 5 seconds, and then proceed to make the Create User request.
It is worth noting that timers do not consume any time from the test, they only pause the thread that is executing. This means other threads will continue to run unless delayed by other timers.
Conclusion
In this article, we provided a comprehensive guide on how to effectively load test an ASP.NET Core Web API using JMeter. From installation and setup to running tests and analyzing results, we’ve covered the essential steps to ensure our APIs can withstand real-world performance demands. By running these tests and analyzing the results, we can gain valuable insights into the performance of our APIs, ensuring they are optimized for high traffic and ready for deployment.